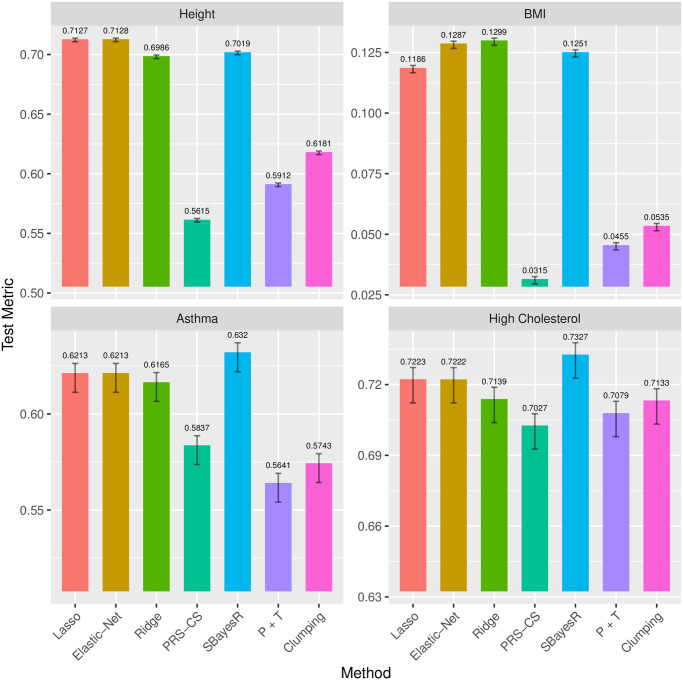
Fig 3. Comparison of the test set predictive performance of the different polygenic risk score (PRS) methods with refitting on the training and the validation set.
R2 are evaluated for continuous phenotypes height and BMI, and AUC evaluated for binary phenotypes asthma and high cholesterol. The error bar uses 2 standard errors to show the statistical significance.

