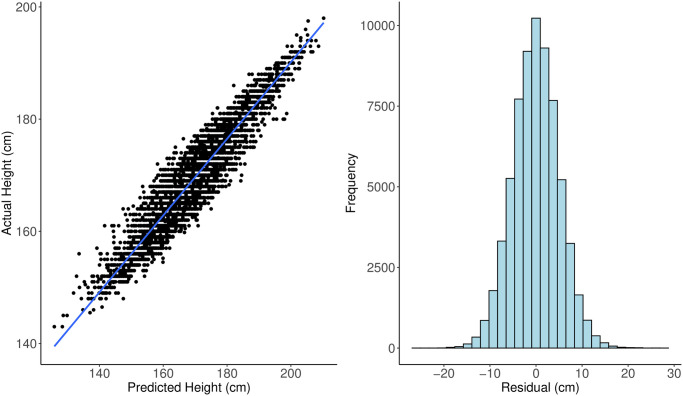
Fig 5.
Left: actual height versus predicted height on 5000 random samples from the test set. A regression line with its 95% confidence band is also added on top of the dots. The correlation between actual height and predicted height is 0.9416. Right: histogram of the lasso residuals for height. Standard deviation of the residual is 5.05 (cm).

