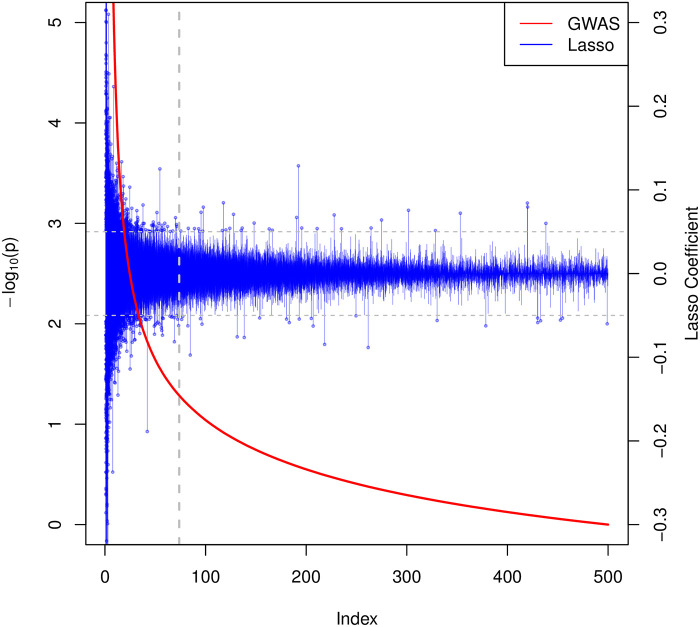
Fig 6. Comparison of the lasso coefficients and univariate p-values for height.
The index on the horizontal axis represents the SNPs sorted by their univariate p-values. The red curve associated with the left vertical axis shows the −log10 of the univariate p-values. The blue bars associated with the right vertical axis show the corresponding lasso coefficients for each (sorted) SNP. The horizontal dotted lines in gray identifies lasso coefficients of ±0.05. The vertical one represents the 100K cutoff used in [21].

