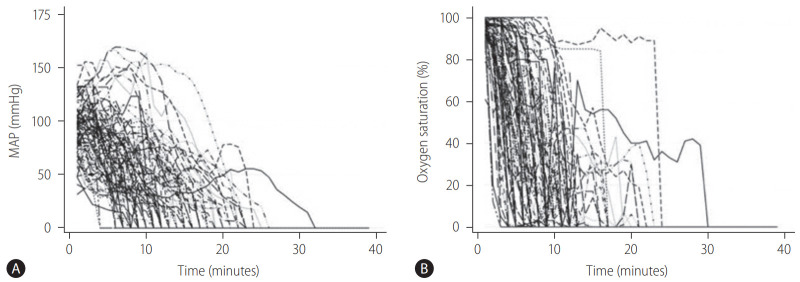
Figure 3.
Hemodynamic trajectories in DCD donors (n=87) from the time of withdrawal of life support to asystole by (A) MAP and (B) SpO2. Adapted from Firl et al. [28] with permission. DCD, donation after circulatory death; MAP, mean arterial pressure; SpO2, peripheral oxygen saturation.

