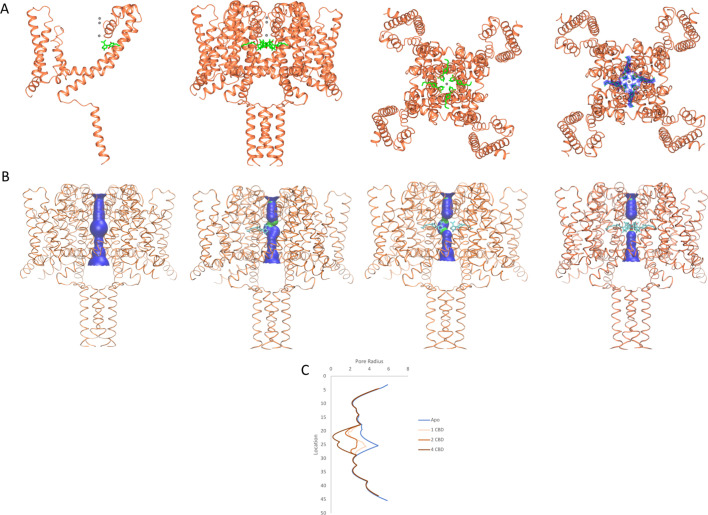
Figure 2. NavMs structures and pore diameters in the absence and presence of CBD.
The NavMs structure (coral) is depicted in ribbon motif. (A) (from the left): For clarity, only a single NavMs monomer with one CDB (green sticks) is shown; the NavMs tetrameric structure with all 4 CBDs bound; top view of NavMs tetramer with all 4 CDBs bound; top view of NavMs tetramer showing the electron density map (blue) demonstrating all 4 CBDs are bound in the tetrameric structure. (B) Pore interior dimensions calculated using the HOLE algorithm (Smart et al., 1993). Progressively from left to right: The apo structure and structures with 1, 2, and 4 CBD molecules present. In this figure the HOLE surface is depicted in blue for pore radii greater than 2.3 Å, and green for radii less than 2.3 Å. There is no occlusion in the absence of CBD, so hydrated sodium ions could freely pass through the pore. The NavMs structure with 4 CBD molecules present shows a full occlusion in the middle of the channel transmembrane pathway (near the centre of the hydrophobic cavity, so ion transport would be prevented [Naylor et al., 2016]). (C) Accessibility plots of pore radii versus position within the pore, in the absence and presence of different numbers of CBD molecules. The plot for the apo structure is in blue, and the plots for the CBD-containing structures with 1, 2, or 4 CBD molecules are in coral, red and black, respectively. The plots for 2 and 3 CBD molecules were the same, so the latter is not shown. In cases where at least some region of the radius is <2.0 Å, sodium ions will not be able to be translocated across the channel (Naylor et al., 2016). This plot thus shows that regardless of whether one or more CBD molecules are present, ion passage will not occur. These figures were produced using VMD software (Humphrey et al., 1996).


