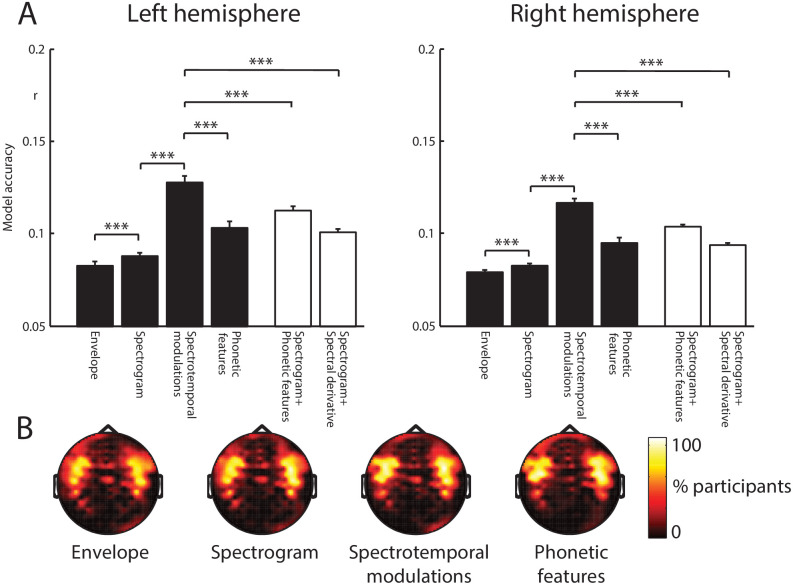
Figure 3. Encoding model comparison.
(A) Mean model accuracies for the four feature spaces (black bars) and the two feature space combinations (white bars). Error bars represent the standard error of the mean after removing between-subject variance, suitable for repeated-measures comparisons (Loftus and Masson, 1994). Braces indicate the significance of paired t-tests ***p<0.001 (B) Topographic distribution of MEG gradiometer sensors over which model accuracies were averaged. In each hemisphere of each participant, we selected 20 sensors with the highest model accuracies. The topographies show the percentage of participants for which each sensor was selected, consistent with neural sources in the superior temporal cortex.
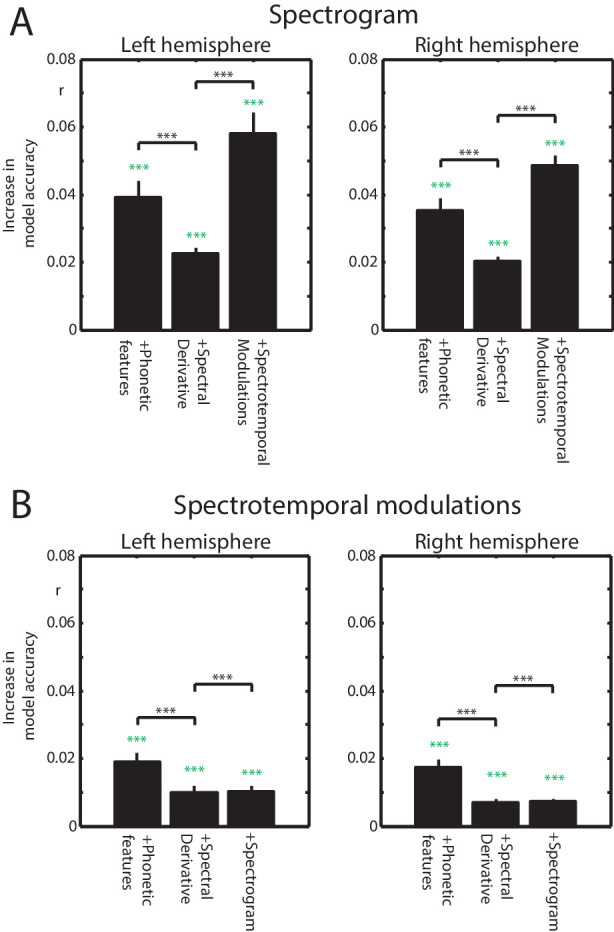
Figure 3—figure supplement 1. Increases in model accuracy when combining feature spaces.


