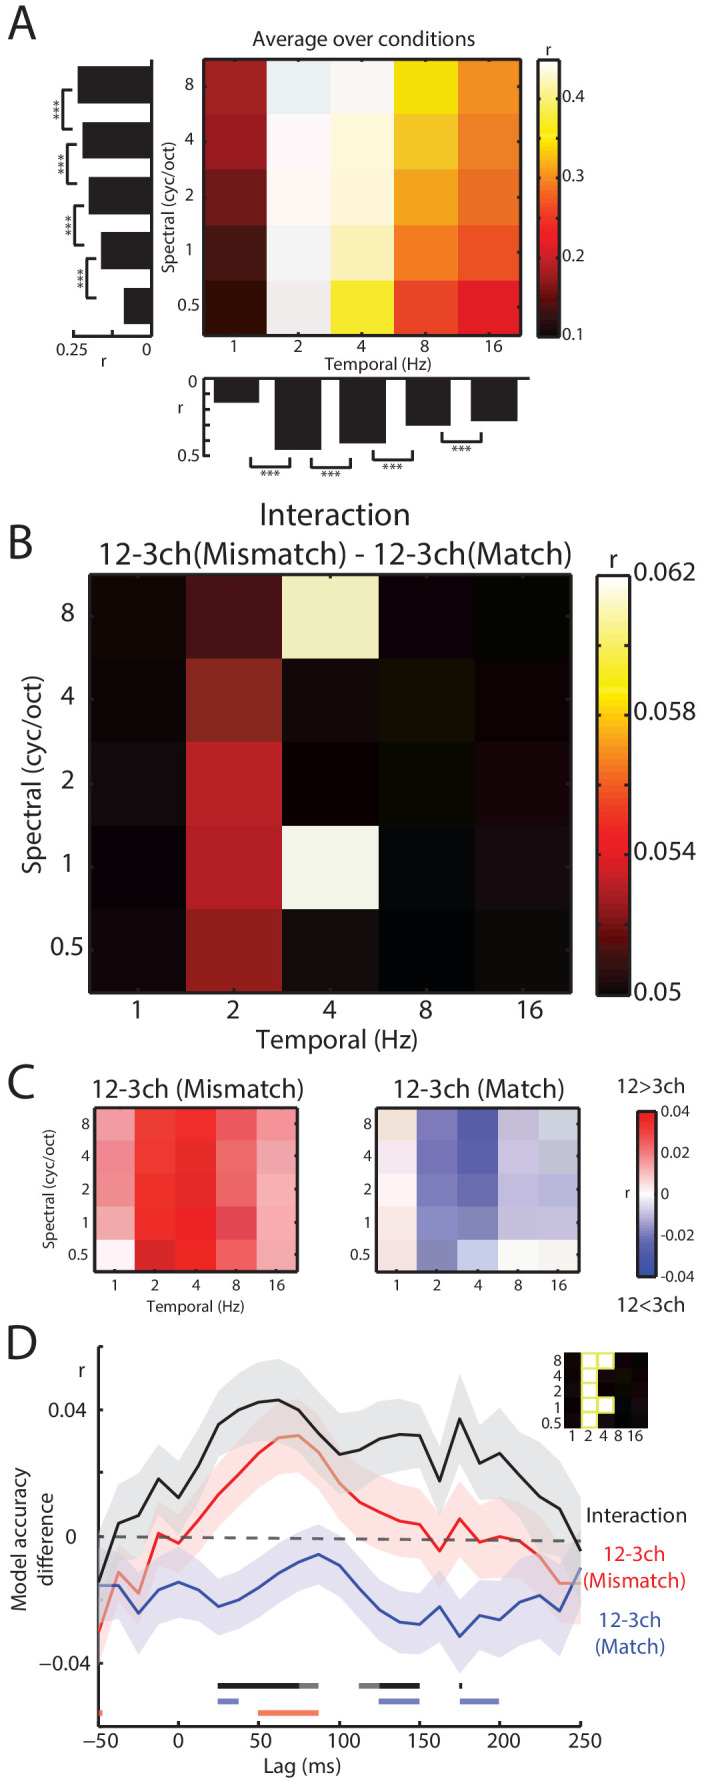
Figure 6. Decoding of spectrotemporal modulations from MEG responses to speech.
(A) The grid shows model accuracies for specific spectrotemporal modulations averaged over conditions. The left bar graph depicts model accuracy for each spectral modulation frequency, averaged over temporal modulations. Bottom bar graph depicts model accuracy for each temporal modulation frequency, averaged over spectral modulations. Braces indicate the significance of paired t-tests ***p<0.001 (B) Effect size (model accuracy differences, r) for the interaction contrast: 12–3 channels (Mismatch) – 12–3 channels (Match). The effect size display has been thresholded so as to only show cells in which the sensory detail by prior knowledge interaction is statistically significant at p<0.05 FDR corrected for multiple comparisons across spectrotemporal modulations. (C) Effect size (model accuracy differences, r) for comparisons between 12 and 3 channels, computed separately for Mismatch and Match conditions. Red shows greater model accuracy for 12 channel than for three channel speech (observed for speech that Mismatches with written text). Blue shows lower model accuracy for 12 channel than for three channel speech (observed for speech that matches written text). ch = channels. (D) Timecourse of decoding accuracy (single-lag analysis). Black trace shows model accuracy differences (r) attributable to the interaction contrast 12–3 channels (Mismatch) – 12–3 channels (Match). Red and blue traces show the contrast 12–3 channels separately for Mismatch and Match conditions, respectively. Shading around each trace represents the standard error of the mean. Horizontal bars at the bottom indicate significant lags for each contrast using the same color scheme as the traces (dark sections indicate p<0.05 FDR corrected across lags and light sections indicate p<0.05 uncorrected). Data have been averaged over the spectrotemporal modulations showing a significant interaction in panel B, indicated also as an inset (top-right).

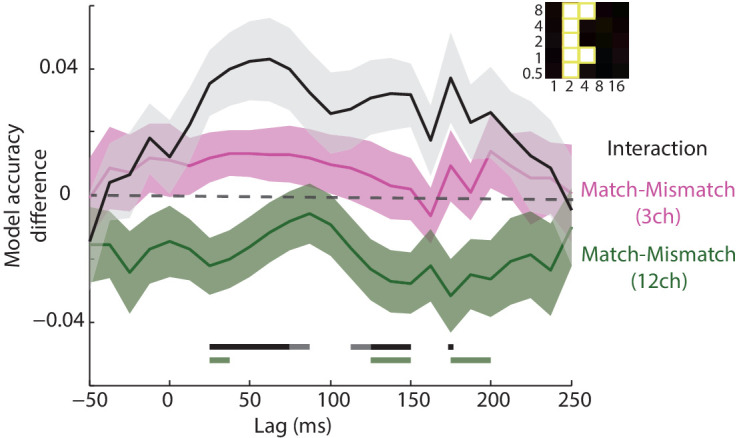
Figure 6—figure supplement 1. Timecourse of decoding accuracy (single-lag analysis).

