. 2020 Oct 21;9:e53550. doi: 10.7554/eLife.53550

Figure 5. Cell-autonomous Epo expression after Arid1a inactivation and Wnt/β-catenin activation in murine and human hepatocytes.

(a) In vivo and ex vivo strategy. WT (n = 8), [Apc]ko-TOTAL (n = 7), [Arid1a]ko-TOTAL (n = 8), and [Apc-Arid1a]ko-TOTAL (n = 10) mice. (b) Inactivation efficiency of Apc and Arid1a genes in isolated hepatocytes. (c,d) RT-qPCR assessment of erythropoietin (Epo) transcription (c) in the hepatocyte and NPC compartments of the livers, (d) in the kidney (1-way ANOVA). (e) In vitro analysis of Axin2, Arid1a (Arid1a floxed-exon detection), and Epo expression by RT-qPCR of mouse hepatocytes after Wnt3a and R-Spondin3 stimulation, and si-Arid1a/si-Control treatments, showing Arid1a knockdown efficiency and Wnt/β-catenin pathway activation, as the mRNA levels of Axin2, a canonical target gene of Wnt signaling, significantly increased (2-way ANOVA). (f) In vitro analysis of Apc, Arid1a, and Epo by RT-qPCR of cryopreserved human hepatocytes after siRNA transfection (one-way ANOVA analysis). Data are presented as the mean ± SEM. ****p<0.0001. Cell culture data are representative of three independent experiments. Related data are found in Figure 5—figure supplements 12, and source data in ‘Figure 5—source data 1; Figure 5—figure supplement 1—source data 1; Figure 5—figure supplement 2—source data 1’.

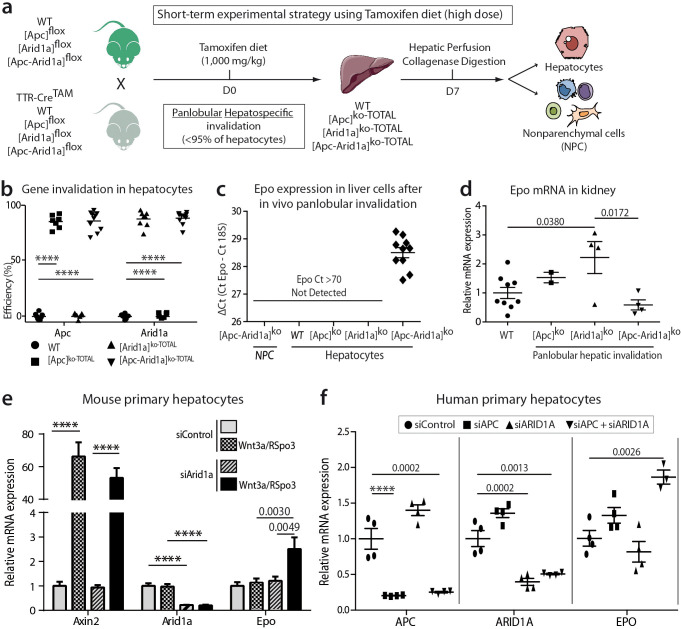
Figure 5—source data 1. Efficiency of gene invalidation (Figure 5b), and gene expression in vivo and ex vivo (Figure 5c-f) in mice and humans.

Figure 5.

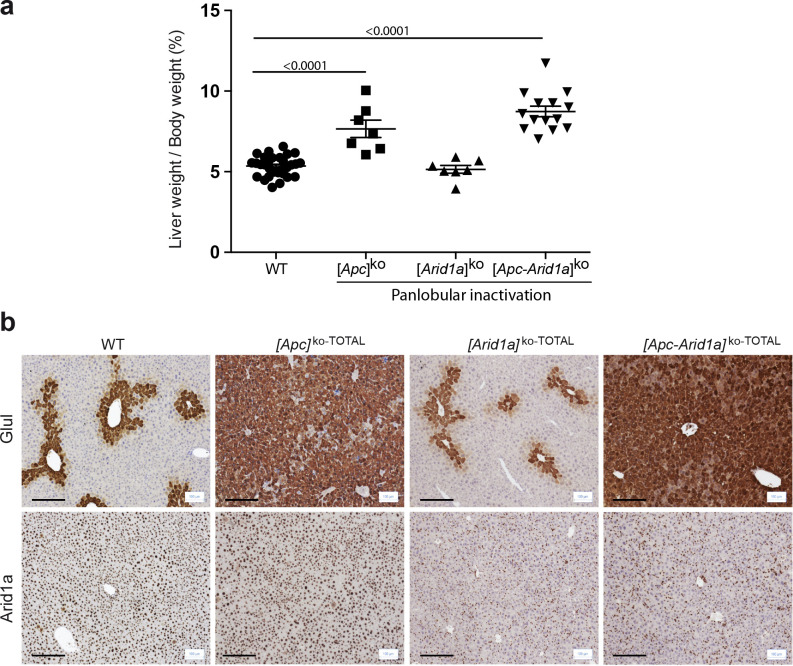
Figure 5—figure supplement 1. Panlobular inactivation of Apc and/or Arid1a in hepatocytes.

Figure 5—figure supplement 1.

(a) Hepatomegaly in mice after panlobular inactivations. WT (n = 30), [Apc]ko-TOTAL (n = 9), [Arid1a]ko-TOTAL (n = 9), and [Apc-Arid1a]ko-TOTAL (n = 14) mice. Data are presented as the mean + SEM and analyzed using one-way ANOVA. (b) Immunostaining of glutamine synthetase (Glul) and Arid1a after Apc and/or Arid1a loss in all hepatocytes in mouse liver. Note the physiological staining of Glul surrounding the centrilobular vein (cv) in WT and [Arid1a]ko-TOTAL livers and the remaining nonparenchymal staining of Arid1a after hepato-specific Arid1a inactivation ([Arid1a]KO-TOTAL and [Apc-Arid1a]KO-TOTAL). Apc loss leads to overactivation of the Wnt/β-catenin pathway and, consequently, increased Glul staining of hepatocytes to the whole lobule. Scale bars = 200 μm.
Figure 5—figure supplement 1—source data 1. Liver to body weight ratio (Figure 5—figure supplements 1a).
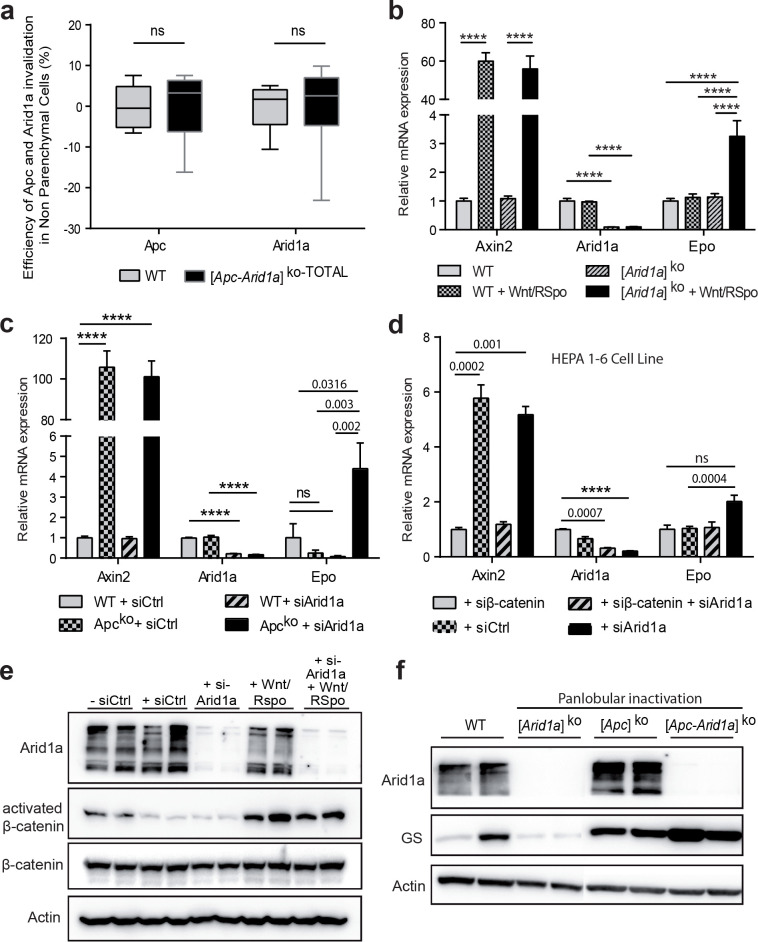
Figure 5—figure supplement 2. Cell-autonomous Epo expression after Arid1a invalidation and Wnt/β-catenin activation in hepatocytes.

Figure 5—figure supplement 2.

(a) No invalidation of Apc and Arid1a genes was found in NPC from [Apc-Arid1a]ko-TOTAL mice (Student t-test). (b) In vitro analysis of Axin2, Arid1a, and Epo transcription by RT-qPCR in primary culture hepatocytes after siRNA-mediated knockdown of Arid1a (siArid1a, 20 nM) and Wnt3a and R-Spondin3 stimulation (Wnt/RSpo) relative to that of control hepatocytes. (c) In vitro expression of Axin2, Arid1a, and Epo in isolated [Apc]ko-TOTAL hepatocytes after siArid1a. (d) In vitro expression of Apc, Arid1a, and Epo in the HEPA1.6 β-catenin-mutated hepatoma murine cell line after siRNA-mediated knockdown of Arid1a and/or β-catenin. (e,f) Western blot of Arid1a and beta-catenin demonstrating effective siRNA-mediated knockdown of Arid1a (20 nM) and Wnt/Spondin stimulation in primary culture hepatocytes (e) and effective inactivation of Apc and/or Arid1a in vivo (f). Data are presented as the mean ± SEM and analyzed with one-way ANOVA. ****p<0.0001. Cell culture data are representative of three independent experiments carried out in triplicate.
Figure 5—figure supplement 2—source data 1. Efficiency of gene invalidation (Figure 5—figure supplements 2a), mRNA expression (Figure 5—figure supplements 2b-d), western blots (Figure 5—figure supplements 2e).