. 2020 Oct 21;9:e53550. doi: 10.7554/eLife.53550

Figure 7. Wnt/β-catenin directly controls EPO expression through 3’ Epo enhancer, in a HIF-independent manner.

(a) Genomic environment of the Epo gene (UCSC Genome Browser, mm9 database) and ChIP-seq peaks at the 3’ Epo enhancer. In blue/red: the crude reads of ChIP-Seq data performed in adult livers against HNF-4a (54). In black: ChIP-Seq under Apcko or βcatko conditions with an antibody against TCF4 (16). In yellow: ENCODE data of H3K27Ac marks in eight-week-old and E14.5 embryonic livers (Histone Mods by ChIP-Seq from ENCODE/LICR). (b) Schematic representation of the EpoE-Luc erythropoietin luciferase reporter, driven by the 3’ enhancer. (c–e) Luciferase reporter assays in mouse primary hepatocytes: (c) after in vitro overactivation of Wnt/β-catenin signaling and Arid1a knockdown (d) after in vivo Cre-loxP-mediated gene inactivation; (e) Effect of hypoxic-mimic conditions using desferrioxamine (DFO), and effect of knockdown of HIF factors (two separate experiments carried out in triplicate). Results are in relative light units, and analyzed using 1-way (d) or 2-way ANOVA (c,e). ****p<0.0001. Related data are found in Figure 7—figure supplements 12, and source data in ‘Figure 7—source data 1; Figure 7—figure supplement 1—source data 1; Figure 7—figure supplement 2—source data 1’.

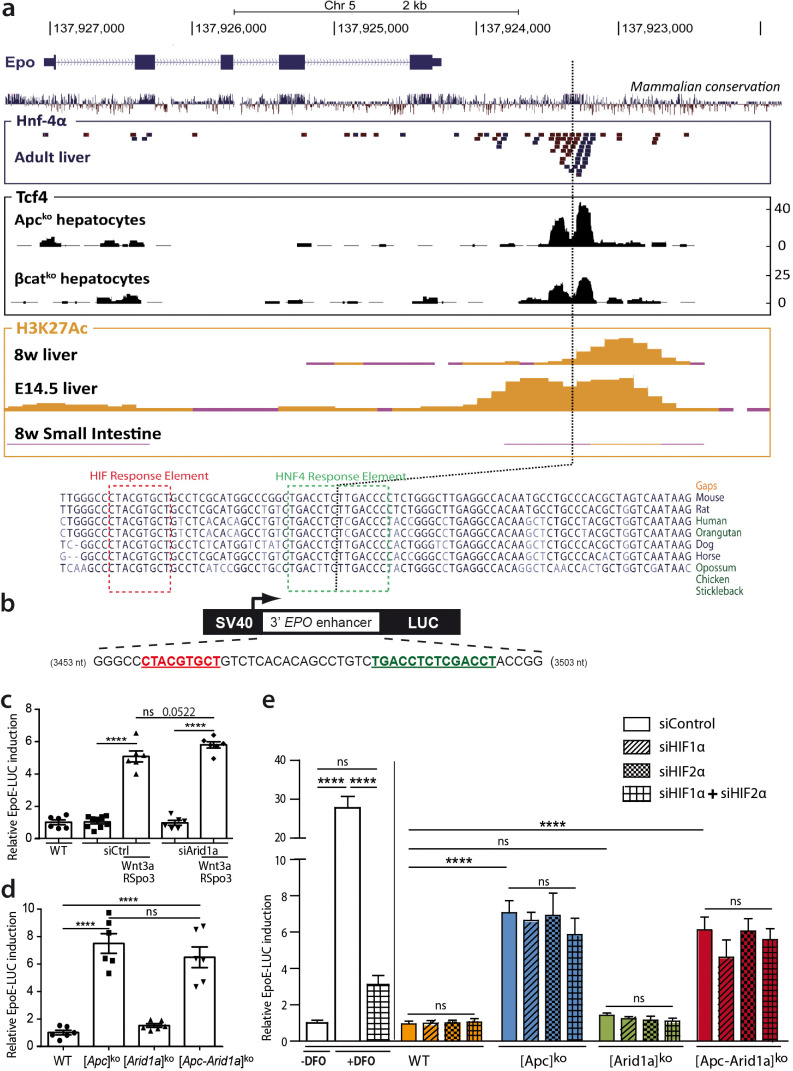
Figure 7—source data 1. EpoE-luc luciferase relative activity (Figure 7c-e).

Figure 7.

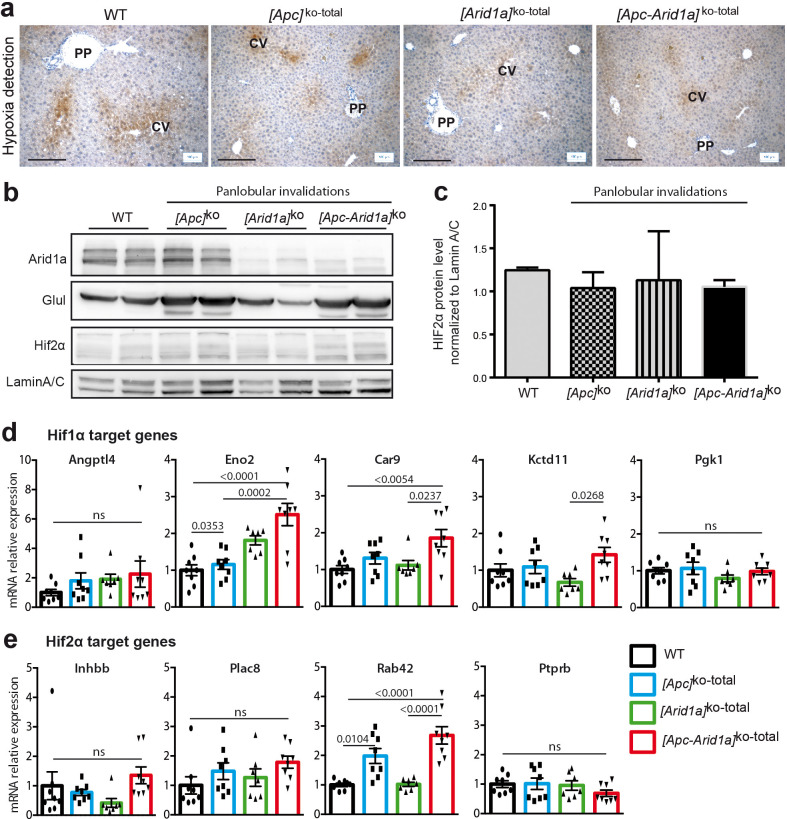
Figure 7—figure supplement 1. Lack of hypoxia and HIF signaling in [Apc-Arid1a]ko-TOTAL livers.

Figure 7—figure supplement 1.

(a) Immunodetection of hepatic hypoxia seven days after Apc and/or Arid1a loss in all hepatocytes in mouse liver. For hypoxia detection in tissues, mice were injected with Hypoxyprobe (NPI Inc) solution via intraperitoneal injection (60 mg/100 g body weight), and livers harvested 1 hr after. Paraffin sections were processed according to the manufacturer’s instructions (Hypoxyprobe-1 Kit). Note the physiological staining surrounding the centrilobular vein (cv) in all conditions. No pathological and extended hypoxia was detected. Scale bars = 200 μm. (b,c) Western blots of Arid1a, Glul, Hif2α, and actin (b), and Hif2α detection quantification (n = 2 for each genotype) (c) showing no Hif2α stabilization in either condition. (d) RT-qPCR analysis of Hif1α and Hif2α target gene expression in livers of 2-month-old mice, 1 week after panlobular Apc and Arid1a invalidation. WT (n = 8), [Apc]ko-TOTAL (n = 8), [Arid1a]ko-TOTAL (n = 7), and [Apc-Arid1a]ko-TOTAL (n = 8) mice. One-way ANOVA tests were done. ns = non significant.
Figure 7—figure supplement 1—source data 1. Quantification of western blots (Figure 7—figure supplements 1c) and mRNA expression (Figure 7—figure supplements 1d-e).
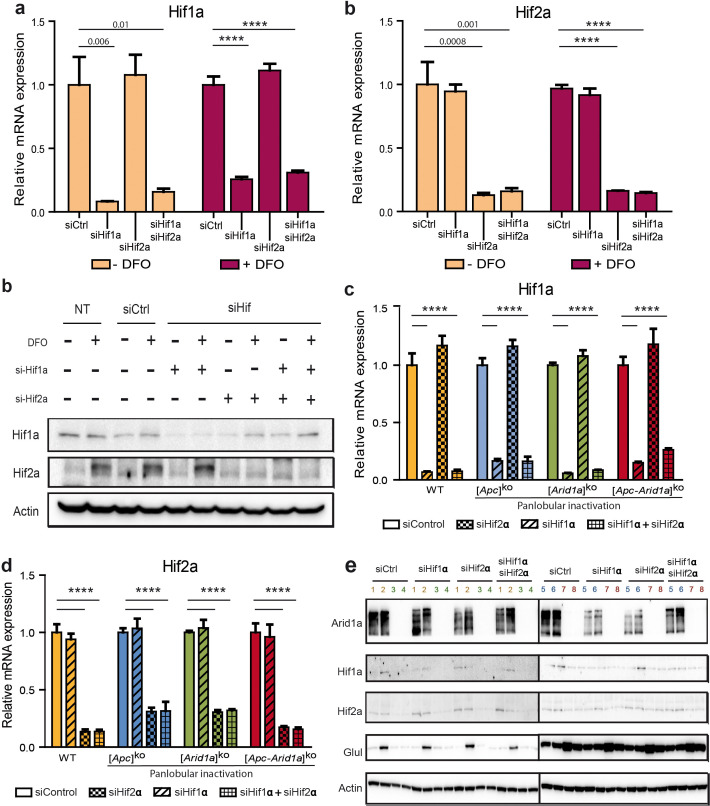
Figure 7—figure supplement 2. Effect of HIF1α and HIF2α knock-downs in mouse primary and transgenic hepatocytes.

Figure 7—figure supplement 2.

(a) RT-qPCR analysis of Hif1α and Hif2α expression in primary culture hepatocytes treated or not with desferrioxamine (DFO) and after siRNA mediated knockdown of Hif1α (20 nM) and/or Hif2α (20 nM). (b) Western blots of Hif1α, Hif2α, and actin showing that Hif1α and Hif2α were stabilized in presence of DFO and that siRNA-mediated knockdown against Hif1α, Hif2α were effective. (c,d) RT-qPCR analysis of Hif1α (c) and Hif2α (d) in primary culture hepatocytes from livers of 2-month-old mice. Experiments were performed 1 week after panlobular inactivation of Apc and/or Arid1a and 48 hr after siRNA mediated knockdown of Hif1α (20 nM) and/or Hif2α (20 nM). (e) Western blots of Arid1a, Hif1α, Hif2α, Glul and Actin showing that no increase of Hif1α and Hif2α was detected in primary culture hepatocytes from [Apc-Arid1a]ko-TOTAL mice compared to control ones. 1,2: WT; 3,4: [Arid1a]ko-TOTAL; 5,6: [Apc]ko-TOTAL; 7,8: [Apc-Arid1a]ko-TOTAL. Data are presented as the mean ± SEM and analyzed by one-way ANOVA ****p<0.0001. Cell culture data are representative of two independent experiments, each performed in technical triplicate.
Figure 7—figure supplement 2—source data 1. mRNA expressions (Figure 7—figure supplements 2a, c, d) and western blots (Figure 7—figure supplements 2b, e).