
Figure 6.
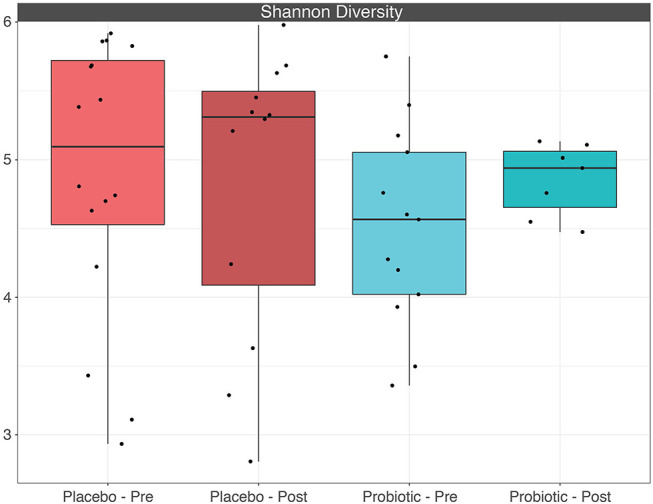
Boxplots depicting α-diversity based on Shannon diversity measure between treatment groups before and after placebo or probiotic administration.
Official websites use .gov
A
.gov website belongs to an official
government organization in the United States.
Secure .gov websites use HTTPS
A lock (
) or https:// means you've safely
connected to the .gov website. Share sensitive
information only on official, secure websites.
Boxplots depicting α-diversity based on Shannon diversity measure between treatment groups before and after placebo or probiotic administration.