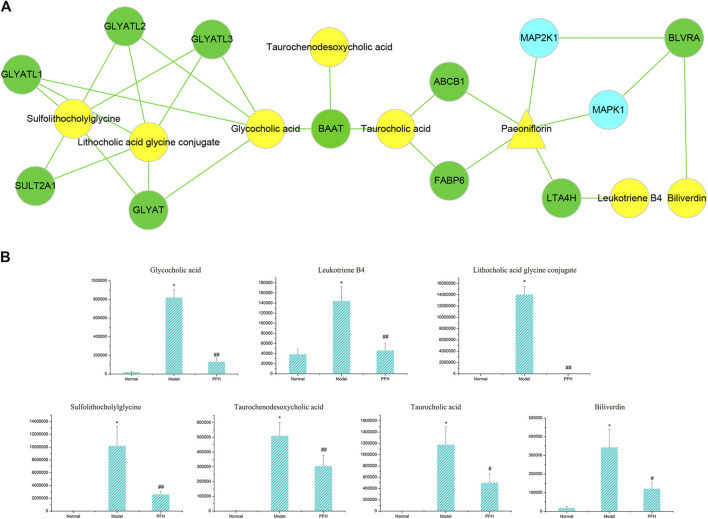
FIGURE 7.
(A) The pivotal “specific metabolite-target-component” interactive network of PF in the treatment of cholestatic liver injury. The yellow triangles represent PF. The blue dots represent the protein targets of PF. The green squares represent the protein targets of specific metabolites. The yellow dots represent specific metabolites. (B) Changes in the metabolic level of the specific metabolites directly and indirectly regulated by PF. ∗ p < 0.01 compared with the normal group; ## p < 0.01, # p < 0.05 compared with the BDL group.

