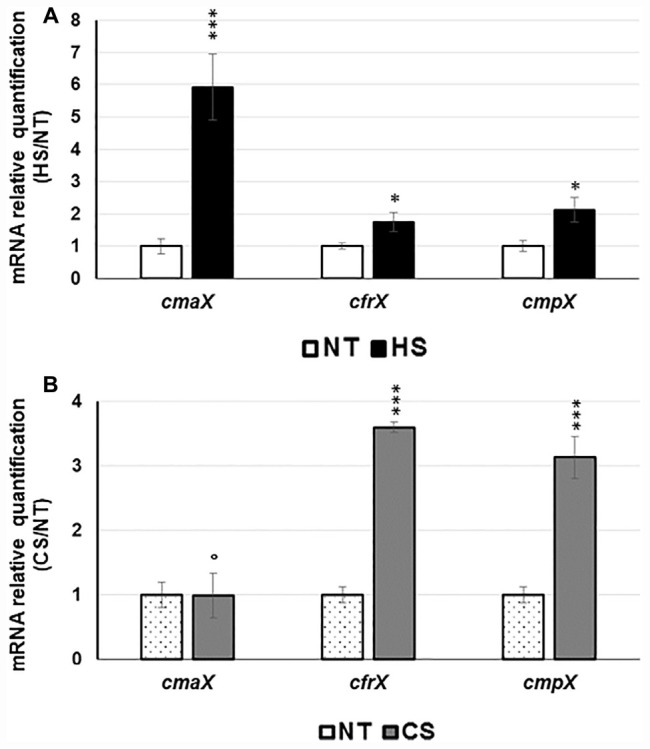
FIGURE 1.

Effect of HS and CS on cmaX-cfrX-cmpX expression P. aeruginosa H103. Histograms show the means of normalized expression for each gene in HS (A) or CS (B) relatively to the control condition at 37°C as calibrator. Error bars indicate SEM of mean, n = 4. Significant differences between the sets of normalized expression obtained in each stress condition were calculated against those obtained at 37°C using a two-tailed t-test, and P-value are indicated by * or *** if < 0.05 or 0.0001, respectively. The symbol ° is indicated for non-significant results.
