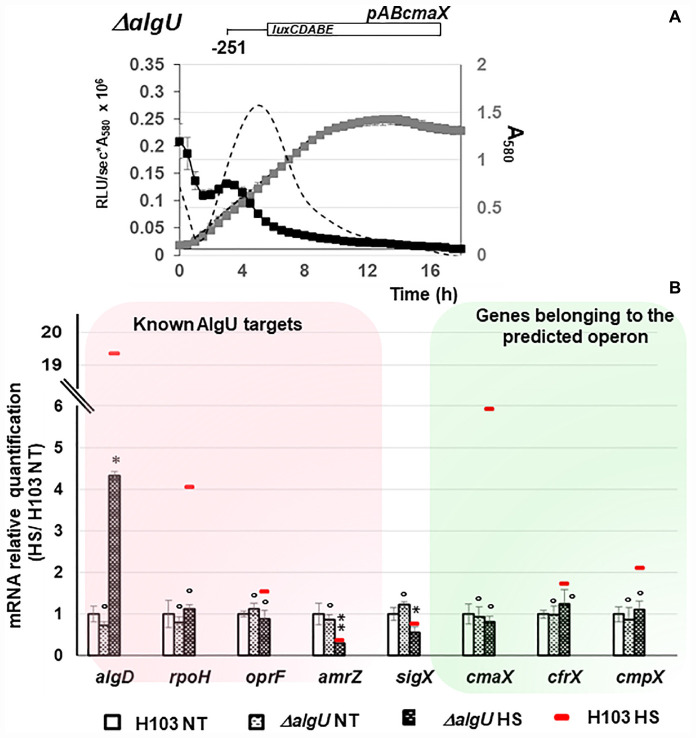
FIGURE 3.
Involvement of AlgU in cmaX, cfrX, and cmpX regulation under HS. (A) Activity pattern of the promoter region upstream cmaX in an algU mutant (black squares) or in H103 (dashed line) during growth in LB at 37°C of the H103 wild-type strain (black dashed line) or ΔalgU mutant (gray squares). n = 3, error bars indicate SD. (B) Histograms show the means of normalized expression relatively to H103 at 37°C as calibrator (white bars) for some known algU targets (red frame) and the studied operon (green frame) in H103 (red line) and in ΔalgU mutant exposed (dashed back bars) or not (dashed white bars) to HS. NT, not treated. Errors bars indicate SEM, n = 4. Significant differences between the sets of normalized expression obtained in HS condition were calculated against those obtained at 37°C for H103 using a two-tailed t-test and P-value, which are indicated by *, **, if < 0.05, 0.001, respectively. The symbol ° is indicated for non-significant results.

