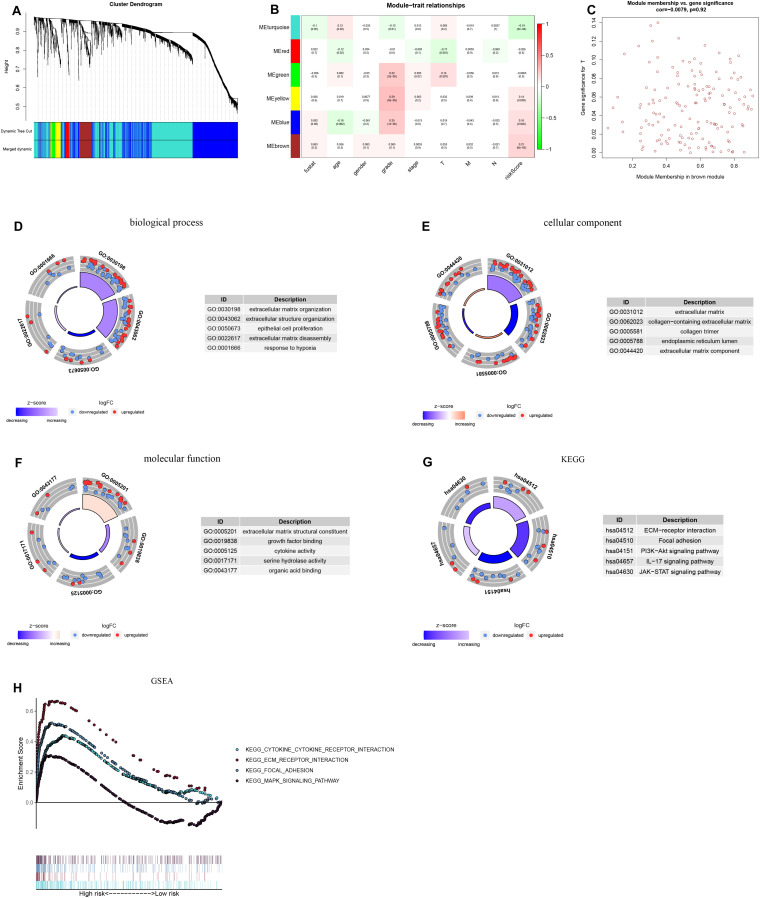
FIGURE 9.
Weighted gene coexpression network analysis (WGCNA) and functional enrichment analysis. (A) Gene dendrogram and module color. (B) Correlations between gene modules and clinical information. (C) Associations of genes in the brown module with the risk score. GO analysis included the (D) biological process, (E) cellular component, and (F) molecular function. (G) KEGG enrichment analysis of target genes. (H) Enrichment plots from GSEA.

