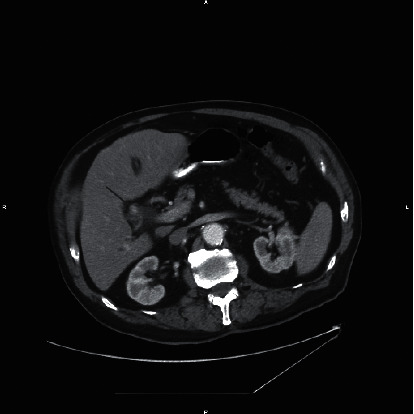
Figure 1.

Axial CT of the abdomen with contrast at the level of the junction of the right and left hepatic ducts demonstrates an 11 mm hyperdensity likely representing a calculus (arrow). This finding is confirmed on the coronal image (arrow) in Figure 2.
