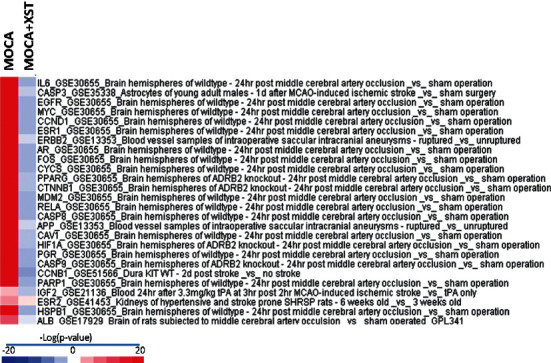
Figure 9.

BaseSpace Correlation Engine analysis of 26 target genes with the GSE biosets based on −log (p value) with the MOCA biosets (GSE61616). Red indicates the upregulation, and blue indicates the downregulation in the style of Target gene_ GSE_biosets. MOCA bioset (first column) was highly correlated with identified 26 target genes. In MOCA + Xuesaitong treatment (2nd column), all MOCA-induced target changes were returned to the normal or to the opposite direction (negative correlations).
