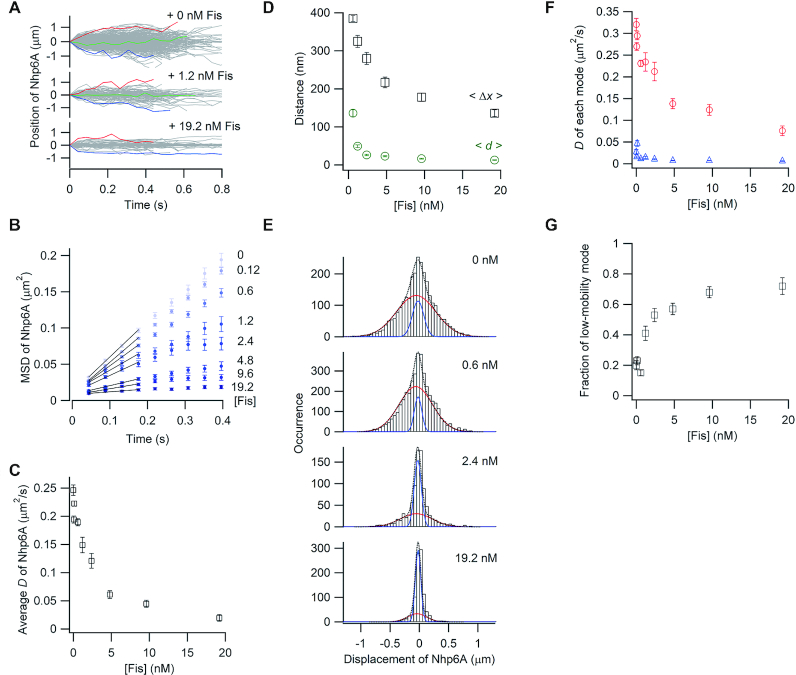
Figure 2.
Single-molecule tracking of fluorescent Nhp6A along DNA bound by non-fluorescent Fis. (A) Single-molecule traces of Nhp6A in the presence of different concentrations of Fis. (B) MSD plots of Nhp6A with 0–19.2 nM Fis. (C) Fis concentration dependence of average diffusion coefficients (D) for Nhp6A. (D) Fis concentration dependence of average travel distances of Nhp6A at 0.4 s intervals (<Δx>, black square) and average spacings between neighboring Fis molecules (<d>, green circles). The error bars of <Δx> were determined from the fitting error of D. The errors of <d> represent standard errors calculated from the fluorescence intensity of at least 20 DNAs bound by fluorescently-labeled Fis. (E) Displacement distributions of Nhp6A at 0.176 s intervals with 0–19.2 nM Fis. Black-dashed curves are the best fitted curves with double Gaussian functions. Red and blue curves are the best fitted curves of the high-mobility and low-mobility modes, respectively. (F) Fis concentration dependence of diffusion coefficients in two modes of Nhp6A. Red and blue represent the diffusion coefficients of the high-mobility and low-mobility modes, respectively. (G) Fis concentration dependence of the fraction of the low-mobility mode of Nhp6A. The error bars in panels C, F and G represent the fitting errors.

