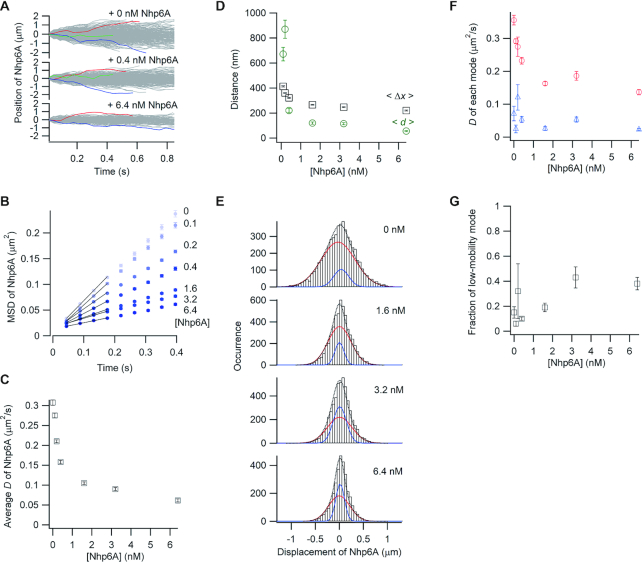
Figure 4.
Single-molecule tracking of fluorescent Nhp6A along DNA bound by non-fluorescent Nhp6A. (A) Single-molecule traces of Nhp6A in the presence of different concentrations of non-fluorescent Nhp6A. b) MSD plots of Nhp6A with 0–6.4 nM non-fluorescent Nhp6A. (C) Non-fluorescent Nhp6A concentration dependence of average diffusion coefficients (D) for Nhp6A. (D) Non-fluorescent Nhp6A concentration dependence of average travel distances of Nhp6A at 0.4 s intervals (<Δx>, black squares) and average spacings between neighboring non-fluorescent Nhp6A molecules (<d>, green circles). (E) Displacement distributions of Nhp6A at 0.176 s intervals with 0–6.4 nM non-fluorescent Nhp6A. Black-dashed curves are the best fitted curves with double Gaussian functions. Red and blue curves are the best fitted curve of the high-mobility and low-mobility modes, respectively. (F) Non-fluorescent Nhp6A concentration dependence of diffusion coefficients in two modes of Nhp6A. Red and blue represent the diffusion coefficients of the high-mobility and low-mobility modes, respectively. (G) Non-fluorescent Nhp6A concentration dependence of the fraction of the low-mobility mode of Nhp6A. The error bars in panels B, C, D, F and G are described in the caption of Figure 2.

