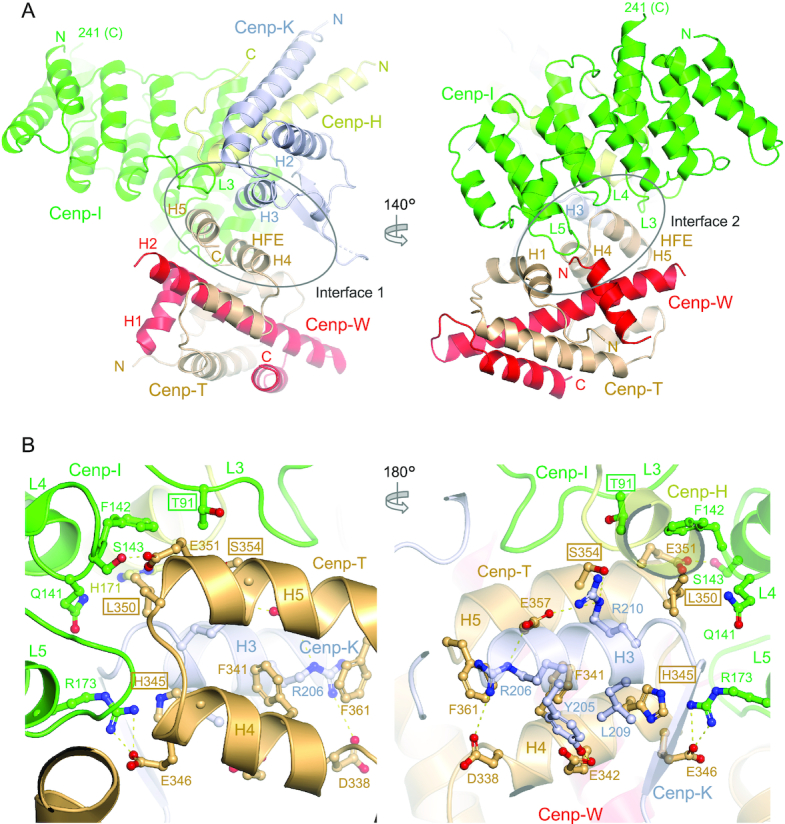
Figure 1.

Overall view of the Cenp-HIKHead-TW complex. (A) Two views of the complex with interface 1 shown on the left and interface 2 on the right. (B) Two views of the Cenp-HIKHead-TW interface 1. The interface is dominated by the HFE of Cenp-T forming a three α-helical bundle with H3 of Cenp-K. Residues mutated in this study are boxed.
