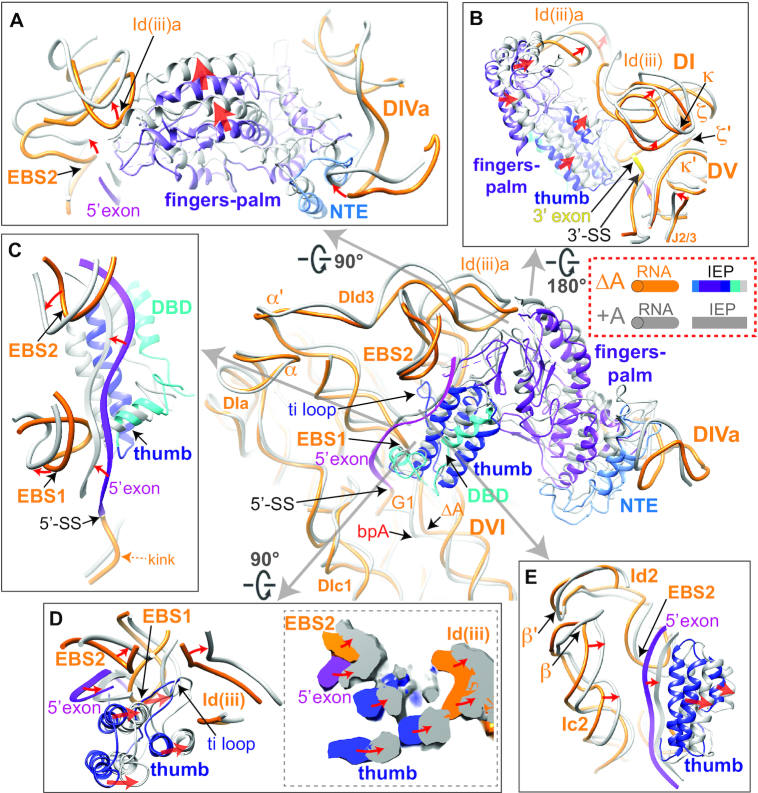
Figure 4.
Rearrangements in RNA–protein interactions comparing the ΔA and +A RNPs The post-catalytic RNA and IEP are shown uniformly in gray, whereas the pre-catalytic RNA is shown in orange and its IEP shown in various colors as illustrated. Red arrows denote the directions of movement upon splicing. (A) RNA–protein interaction at the fingers-palm domain. DId(iii)a is distorted by the movement in the fingers-palm domain upon splicing. NTE: N-terminal extension. (B) RNA–protein interaction distorts DId(iii)a to remodel DV. (C) The RNA–protein interactions at the 5′ exon region showing 5′ exon being sandwiched by the EBSs, the thumb and DBD domains. (D) Enhanced RNA–protein interaction at the thumb domain upon splicing and the influence on exon placement. The cross-section of density maps of the ΔA and +A RNPs is shown in the dotted box on the right. (E) Coordinated movements of DIc2 accompanying the adjustments in thumb domain upon splicing. DIc2 moves towards the same direction as the thumb domain, contributing to stabilization of the exon in the new location.

