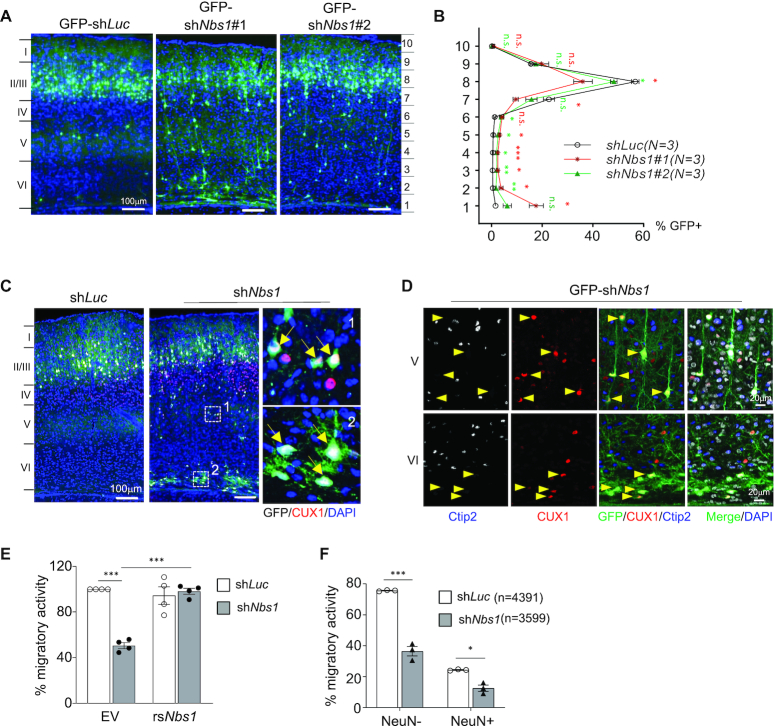
Figure 2.
Nbs1 deficiency inhibits neuronal migration. (A) Brain sections of P16 mice electroporated with indicating GFP-shRNA vectors at E15.5 are shown. GFP-shLuc targeting luciferase is control and GFP-shNbs1#1 or shNbs1#2 targets Nbs1. (B) The brain cortex from (A) was equally divided into ten segments and the percentage of GFP+ cells from each segment quantified based on three to five sections from each of three (N) animals of each condition (right). Data are Mean ± SEM. Two-way ANOVA with Holm-Sidak's multiple comparison test was used for statistical analysis. *P < 0.05; **P < 0.01; ***P < 0.001; n.s. = not significant. (C) Cortical sections were imaged after staining with CUX1, a marker for recently born neurons. The right panels are enlargements of the indicated areas of shNbs1 images. Arrows indicate GFP+CUX1+ cells. (D) The layers V and VI of the cortex (C) are shown after staining with CUX1 and early-born neuronal marker Ctip2. Arrowheads indicate GFP+CUX1+Ctip2– cells. (E) In vitro transwell migration of Neuo2A cells after co-transfection with shLuc or shNbs1 together with GFP-empty vector (EV) or GFP-shNbs1-resistant Nbs1 (rsNbs1) vector. The migratory activity was analyzed 24 h after plating on the membrane. Data are Mean ± SEM of minimum three independent experiments. Statistical analysis was performed using Two-way ANOVA followed by Tukey's post-hoc test. ***P < 0.001. (F) Transwell migration assay of primary neurons from E17.5 cortex of embryos that were electroporated with indicated shRNA expression vectors at E15.5. The migratory activity was calculated as GFP+, or GFP and NeuN double-positive (GFP+NeuN+) cells among the number of DAPI positive cells counted (n). Data are mean ± SEM of at least three embryos. Statistical analysis was performed using two-way ANOVA followed by Tukey's post-hoc test. *P < 0.05, **P < 0.01, ***P < 0.001.

