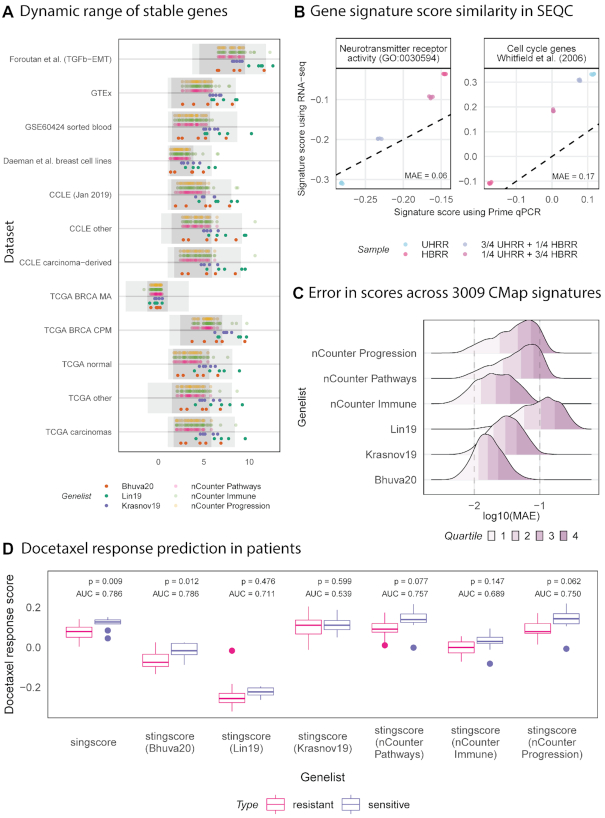
Figure 4.
Scores computed from transcriptome-wide RNA-seq measurements are comparable to scores computed from a small panel of genes and our set of stable genes. (A) Median expression of the top 5 stable genes from each of the prioritisation-based lists are plot against the interquartile range (dark grey) and 1%-99% range (light grey) within each of the training and validation datasets. Our list tends to have a wider dynamic range than other lists across most datasets and our genes are well spaced across this range, therefore, they are more suitable for scoring using stingscore. (B) The brain RNA sample (HBRR) scores highest for the brain-specific signature (neurotransmitter receptor activity) with scores reducing as the proportion of brain RNA reduces. The inverse is observed with a cell cycle gene signature which should be more active in cancers. Scores computed using singscore are comparable to those computed using stingscore and our top 5 stable genes. (C) Difference between scores computed with singscore and stingscore using different sets of stable genes measured as the mean absolute error (MAE). Quartiles of MAE are coloured. Top 5 stable genes are selected for prioritisation-based lists (Lin et al. (22) and Krasnov et al. (21)). Scores are computed for 3009 gene signatures across a total of 75012 expression measurements from the connectivity map project (CMap). (D) Scores computed with singscore and stingscore using different sets of stable genes are used to discriminate docetaxel sensitive (n = 10) patients from resistant (n = 14). Patients are scored using a docetaxel signature derived from CMap (52 up-regulated genes). Area under the receiver operating characteristic curve (AUC) are computed along with P-values from a t-test. Singscore and stingscore with our set of stable genes provide the best separation of samples.

