
Figure 4.
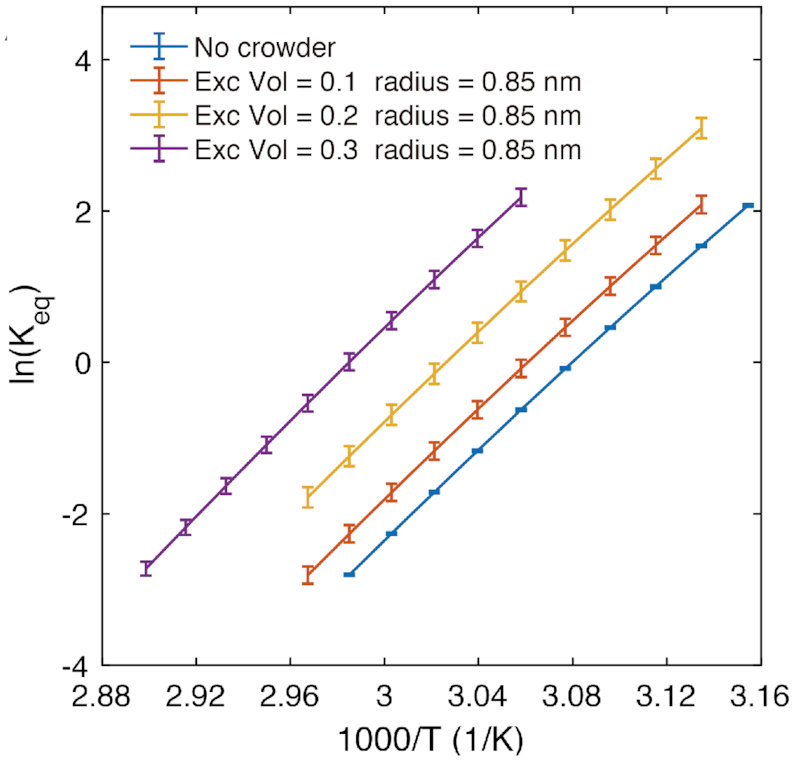
The Van’t Hoff plots for the 8-mer duplex. The entropic contribution is compared for a fixed rc = 0.85 nm and ϕ ranging from 0.1 to 0.3.
Official websites use .gov
A
.gov website belongs to an official
government organization in the United States.
Secure .gov websites use HTTPS
A lock (
) or https:// means you've safely
connected to the .gov website. Share sensitive
information only on official, secure websites.
The Van’t Hoff plots for the 8-mer duplex. The entropic contribution is compared for a fixed rc = 0.85 nm and ϕ ranging from 0.1 to 0.3.