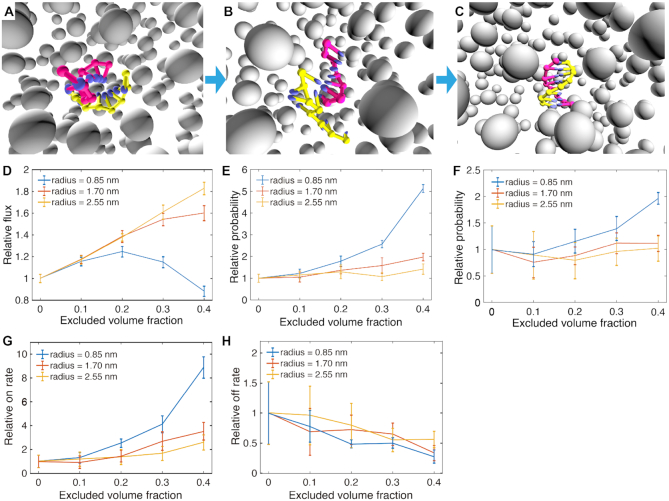
Figure 7.
The kinetic FFS study of DNA 8-mer formation in different crowding conditions. (A–C) The illustrations show typical configuration at the three interfaces used to calculate transition rates for the hybridization process: (A) proximity between complementary bases, (B) the first base pair formed, (C) all 8 bp formed. The grey, isolated particles are crowders with the same radius, shown in perspective view. (D–F) The relative reaction flux/transition probabilities across the three interfaces, respectively. (G–H) The relative kon and koff for 8-mer duplex formation.

