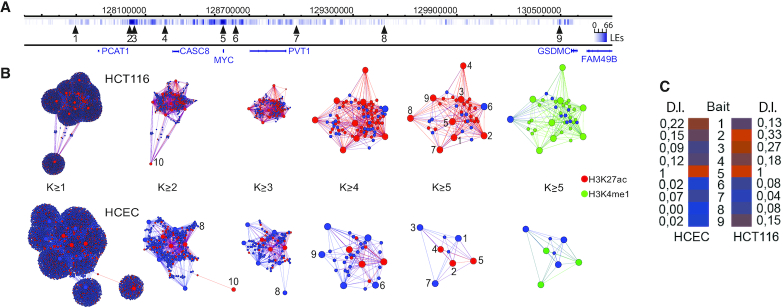
Figure 1.
The generation of a hierarchical chromatin network impinging on MYC. (A) The position of the 9 Nodewalk baits around the MYC locus with bait nr 10 that originated from chromosome 5. Vertical lines indicate the interactors and their ligation events (LE) impinging on MYC. (B) The network structures from 20 000 HCT116 cells and 20 000 human normal colon epithelial cells (HCEC) stratified by their k- values (8). The red and green nodes identify regions overlapping with H3K27ac and H3K4me1 peaks, respectively. The size of each node reflects the number of the interactors. The size of each node reflects the number of the interactors with small nodes reflecting non-bait regions common to two or more baits. (C) Dynamic importance index (D.I. Index) analysis of the nine enhancer baits in HCEC and HCT-116 cells.

