Figure 3.
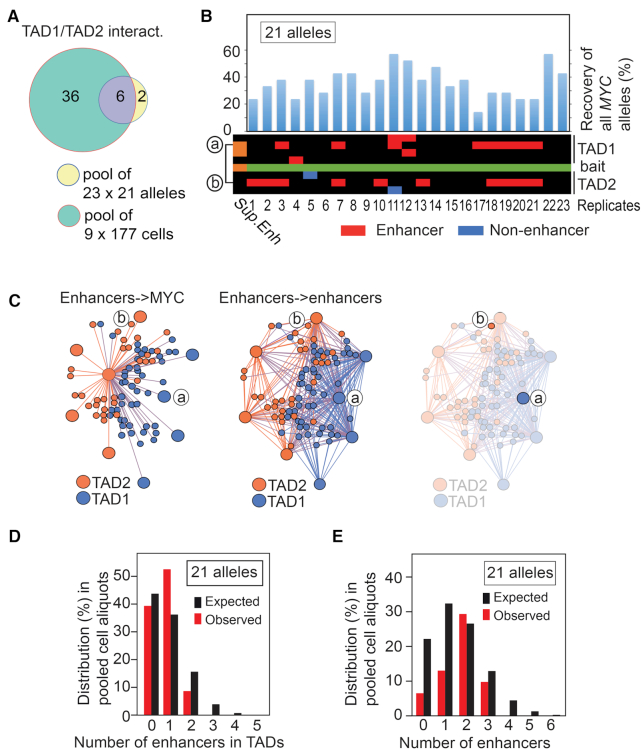
MYC interacts with flanking enhancers in a mutually exclusive manner. (A) Overlap between pooled libraries from 34.8 pg input and pooled libraries from 177 cells within TADs. (B) The overall recovery of MYC bait alleles in 23 × 34.8 pg aliquots, each of which corresponds to 21 alleles input material is shown on top of a heatmap of the MYC network. The interactors were organized in cis keeping their relative position on the physical map. ‘a’ and ‘b’ indicates the location of the interactors represented in C). (C) The virtual enhancer hubs observed within TAD1/2 in the ensemble libraries. The right-most network image identifies the lack of physical and direct interaction between nodes ‘a’ and ‘b’. (D) The observed frequencies of enhancers interacting with MYC bait compared to the expected frequencies scaled down from 50 ng 3C DNA input to 21 alleles. (E) The observed frequencies of enhancers interacting with MYC bait compared to the expected frequencies scaled down from 50 ng 3C DNA input to 21 alleles. Values were calculated from genome wide interactors. A statistical test showed that the P-values were found to be 0.5648 and 0.4523 for panels D and E, respectively. In both instances it thus failed to reject the null hypothesis at the 95% confidence level.

