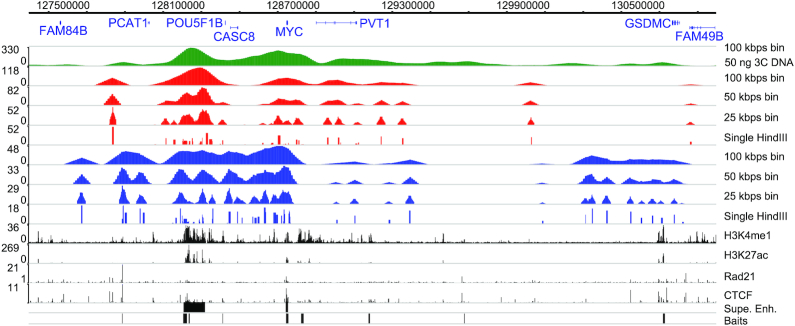
Figure 4.
The stochastic character of the MYC network. Comparison of interaction profiles in the TADs flanking MYC with interaction profiles binned into larger windows resulting from Nodewalk analyses using 50 ng 3C DNA/10 000 cells input (green), 0.88 ng 3C DNA aliquots (red) and 177 cell aliquots (blue).

