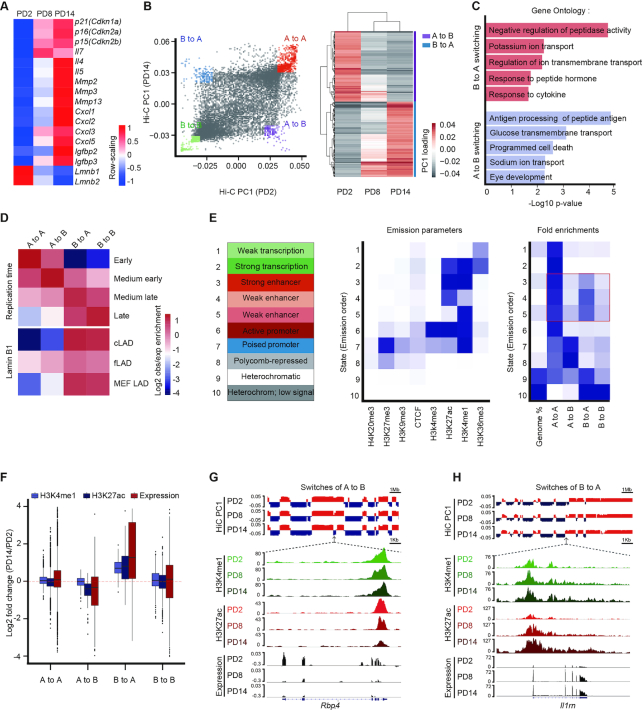
Figure 1.
Remodeling of the enhancer landscape occurs during A and B compartment switching. (A) The heatmap displaying normalized genes expression among PD2, PD8 and PD14. Senescence-relevant genes are listed. The −1, +1 values are the t-statistic used to normalize the expression TPM values. (B) The first principal components values (PC1) from the Hi-C correlation matrix at 100-kb resolution represented the A (positive value) and B (negative value) compartment. Classification of four categories for A and B compartment switching as defined by PC1 values in a paired comparison of PD2 and PD14 (left) or comparison among PD2, PD8, and PD14 (right). (C) GO analysis of compartment switching from B to A (red, top) and A to B (blue, bottom) by GREAT. The top five most significant GO terms and their enrichment scores are displayed. (D) Overlapping enrichment for the genomic features of replication time and LAD distribution at the loci of the four categories of compartment switching. (E) Eight chromatin markers were used to train the chromatin states in MEFs by chromHMM. Heatmaps showing the distribution of the four compartment switching categories in epigenomic-marked chromatin states; enhancers are highlighted in a red box. (F) Violin plots displaying the H3K27ac, H3K4me1 and gene expression levels of PD2 versus PD14 in the four compartment switching categories. (G, H) Integrative Genomics Viewer (IGV) showing A to B compartment switching (G) and B to A compartment switching (H) dynamics accompanied by epigenetic enhancer profiling and gene expression analysis at the Rbp4 and Il1rn gene loci.

