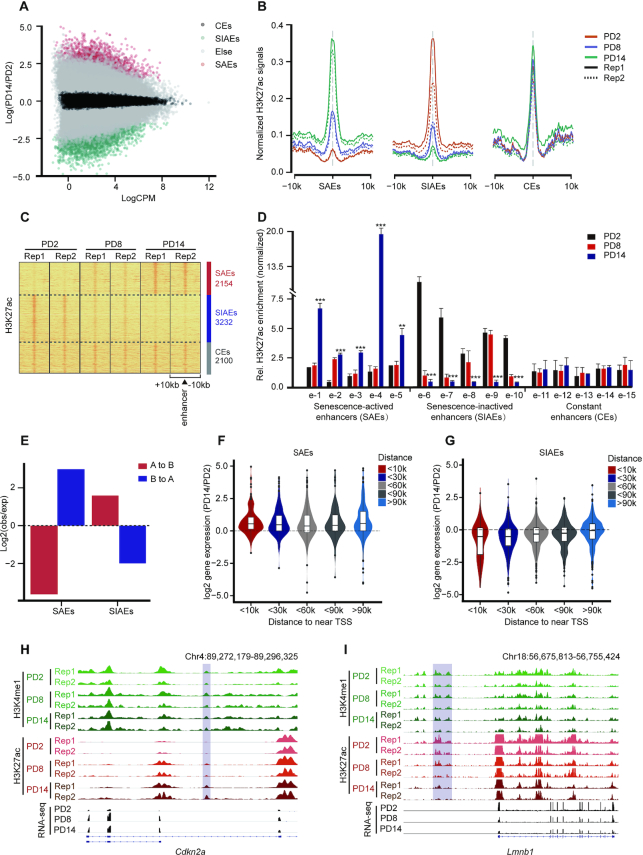
Figure 2.
Genome-wide identification and characterization of senescence-associated enhancers. (A) Scatter plot showing the normalized H3K27ac signal dynamics in PD2 and PD14. SAEs, senescence-activated enhancers; SIAEs, senescence-inactivated enhancers; and CEs, constant enhancers. (B) Aggregate plots of H3K27ac showing the replicated SAEs, SIAEs and CEs in MEFs, at the enhancer peak center. (C) Heatmaps of H3K27ac signals surrounding the SAEs, SIAEs, and CEs. The number of enhancers in each of the three categories is listed on the right. Rows correspond to ±10-kb regions across the midpoint of each H3K27ac-enriched union enhancer. (D) The relative levels of H3K27ac for randomly selected SAEs and SIAEs in MEFs of different passage numbers were measured by ChIP-qPCR. The enrichment of H3K27ac was normalized to 10% input, and IgG was used as a negative control. Error bars represent the S.D. obtained from three independent experiments. *P < 0.05, **P < 0.01, ***P < 0.001. One-way ANOVA with Dunnett's multiple comparison test was performed. (E) The proportion of compartment switching clusters located in the different enhancer categories. (F, G) Violin plots showing the correlation between the expression of genes adjacent to the enhancers (SAEs: F, SIAEs: G) and the distances to the TSSs of the nearest genes during senescence. (H, I) H3K27ac ChIP-Seq occupancy profiles at representative SAE and SIAE loci for Cdkn2a and Lmnb1.

