Figure 3.
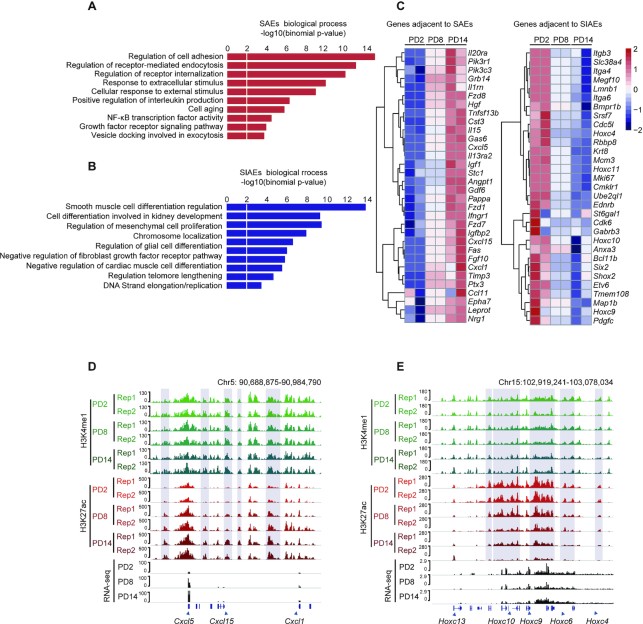
Senescence-activated enhancers (SAEs) affect adjacent SASP gene expression profiles. (A, B) Gene Ontology enrichments of SAEs (A) and SIAEs (B) by GREAT. The length of each bar represents the enriched P value for each biological process. (C) Heatmaps displaying normalized gene expression among PD2, PD8, and PD14. SAE- (left panel) and SIAE- (right panel) adjacent genes are listed. (D, E) H3K27ac ChIP-Seq occupancy profiles at representative SAE and SIAE loci for the Cxcl and Hoxc families. The genes in these two families that are adjacent to SAEs and SIAEs are marked by blue boxes.

