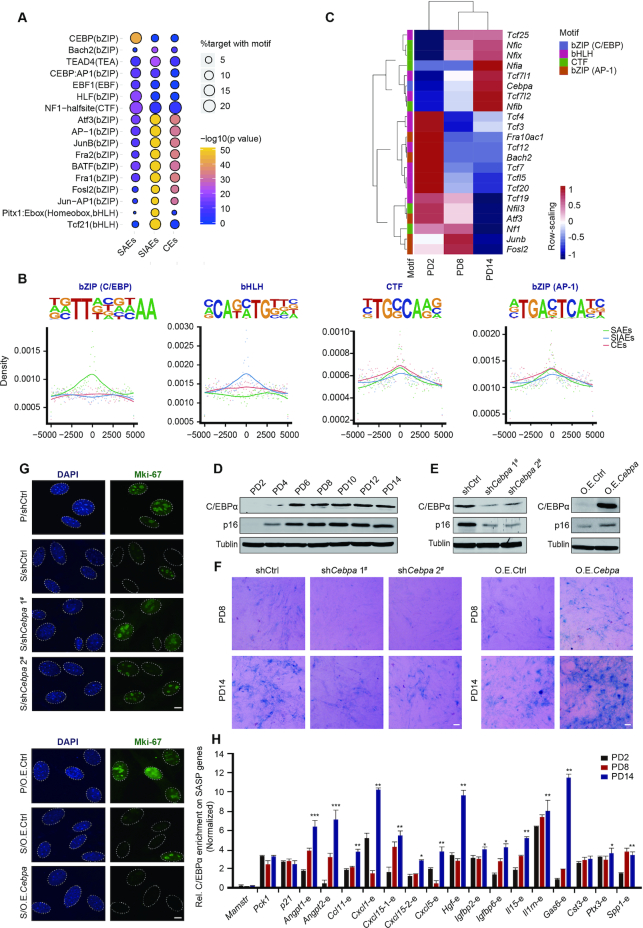
Figure 4.
Recruitment of C/EBPα leads to premature cellular senescence. (A) Top-ranked enriched motif families among SAEs, SIAEs, and CEs (regions defined by Figure 2A−C) determined via Homer2 algorithms are listed. (B) Position-weight matrix showing the observed enhancer densities in four motif families containing C/EBP, AP-1, bHLH, and CTF sites. (C) Heatmaps showing the expression of filter genes from four motif families. The colorful modules are consistent with the classification in (B). (D) Western blotting analysis of total C/EBPα and p16 protein expression in serially passaged MEFs. Tubulin served as a loading control. (E) Western blotting showing the expression of C/EBPα and p16 after down- or upregulation of C/EBPα expression via lentiviral particles. Tubulin served as a loading control. (F) SA-β-gal staining in PD8 and PD14 after down- or upregulation of C/EBPα expression via lentiviral particles. Scale bar, 50 μm. (G) Immunofluorescence staining of Mki67 after down- or upregulation of C/EBPα expression. DAPI staining shows the position of the nucleolus. P represents proliferating cells, and S represents senescent cells. Scale bar, 10 μm. (H) The relative levels of C/EBPα and SASP genes flanking SAEs in MEFs of different passage numbers were measured by ChIP-qPCR. Specifically, C/EBPα enrichment for Mamstr served as a negative control, and C/EBPα enrichment for Pck1 and p21 served as positive controls, as previously described (68,69). The enrichment of C/EBPα was normalized to 10% input. Error bars represent the S.D. obtained from three independent experiments. *P < 0.05, **P < 0.01, ***P < 0.001. One-way ANOVA with Dunnett's multiple comparison test was performed.

