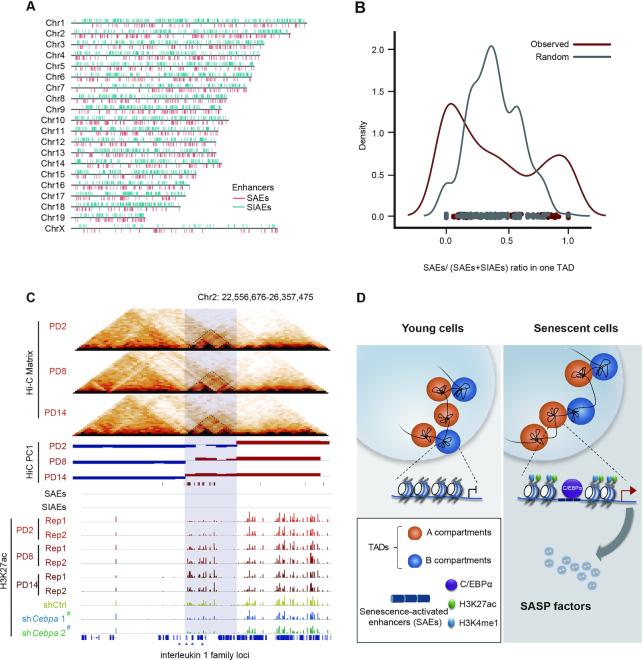
Figure 6.
Enhancer repertoires orchestrate gene expression in TAD units. (A) The distribution of SAE and SIAE clusters along each chromosome; each red bar represents an SAE location in the reference genome, and the blue bars represent SIAE locations. (B) The SAE density calculating the ratio of SAE to total enhancer (SAE + SIAE) in one TAD unit as compared with random sequences during senescence. (C) Visualization of the TAD structure, A/B compartments, and H3K27ac signals at interleukin 1 family loci. TADs are marked by dashed triangles. A compartments are colored red, and B compartments are colored blue. H3K27ac signals are shown as red bars during senescence and as blue bars following downregulation of C/EBPα expression. (D) Summary schematic depicting the chromatin architecture, epigenetic enhancer repertoires, and SASP gene kinetics mediated by C/EBPα during cellular senescence. The imaginary line under the compartments denotes the detailed enlargement at the transcriptional level.

