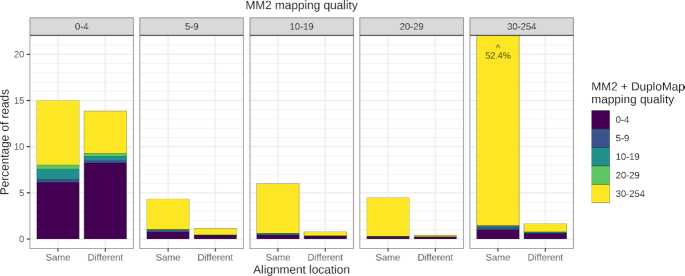
Figure 3.
Comparison of mapping qualities and alignment locations for reads aligned with Minimap2 (MM2) and Minimap2 + DuploMap on the HG002 CCS dataset. Five bar plots corresponding to five bins of mapping quality using Minimap2 are shown. Each bar plot shows the percentage of reads—color coded by mapping quality after realignment using DuploMap—that had the same or different alignment location using Minimap2 and Minimap2 + DuploMap. One of the bars (30–254 bin) that corresponds to 52.4% of reads is clipped for visual clarity.

