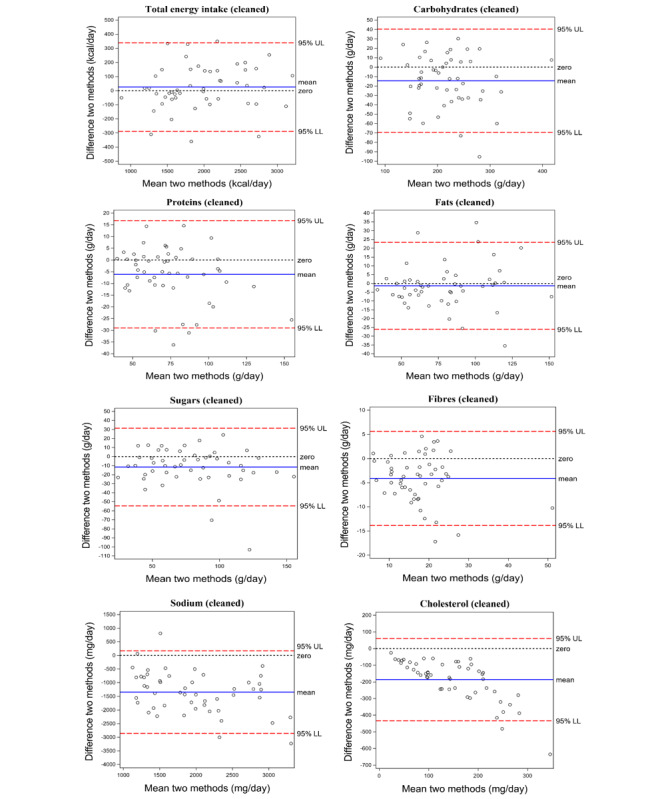
Figure 1.

Bland-Altman plots for energy intake and nutrient values of the cleaned T2 dataset, with Nubel as the reference method and MyFitnessPal as the other method for nutrient intake analysis. The difference between the 2 methods is calculated as follows: MyFitnessPal – Nubel. The 95% upper limit (UL) and lower limit (LL) of agreement (SD 1.96) are depicted as long dashed lines. The full line and short-dashed line indicate the mean difference and zero, respectively.
