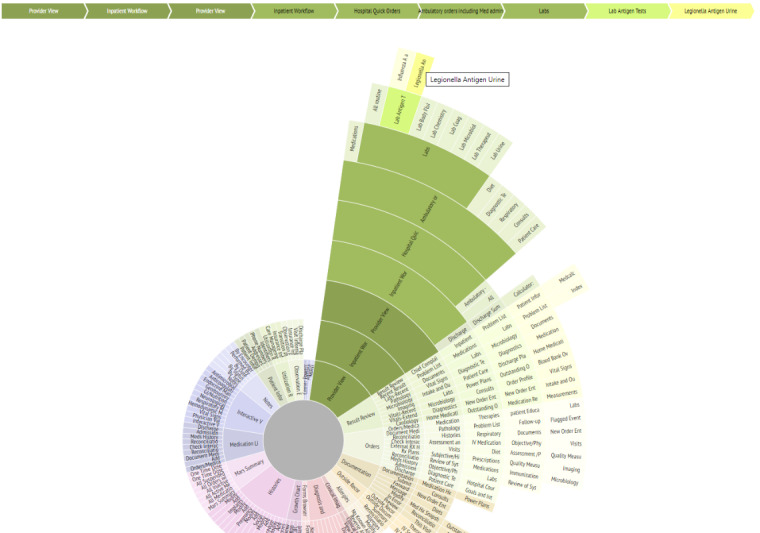
Figure 2.

Interactive sunburst highlighting one pathway (in green) from a root screen (Provider View) to a specific element (Legionella Antigen Urine lab results). The traced pathway is also described in the linear flow above the sunburst diagram. This diagram shows how 9 different screens must be navigated to access the desired element from the main screen.
