Fig. 5.
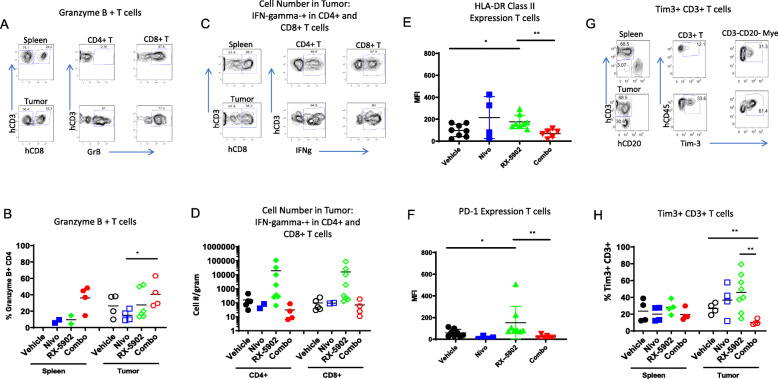
Human T cell function in spleens and tumors of hu-CB-BRGS MDA-MB-231 bearing mice. Flow cytometry gating strategy for measurement of a Granzyme B, and c IFNγ producing CD4 and CD8 T cells in the spleen or tumors and the calculated frequencies of b Granzyme B, and d relative cell numbers, per g of tumor, of IFNγ producing CD4 and CD8 T cells in spleens and tumors of each hu-CB-BRGS mouse. a represents sample from Combo treated mice, and c from RX-5902 treated mice. Expression (as determine by mean fluorescence intensity, MFI) of e HLA-DR activation, and f inhibitory PD-1 molecules on human T cells in tumors. g Flow cytometry analysis measuring frequency of Tim3+ cells among T cells in the spleens and tumors. h Frequency of Tim-3+ cells among human T cells in spleens and tumors of hu-CB-BRGS tumor-bearing mice. For all graphs, each dot represents data from an individual spleen or tumor from mice receiving either no drug (Vehicle), nivolumab alone (Nivo), Rexahn-5902 alone (RX-5902) or a combination of nivolumab and Rexahn-5902 (Combo) treatment. Lines represent arithmetic means. p-values: * < 0.05, ** < 0.01

