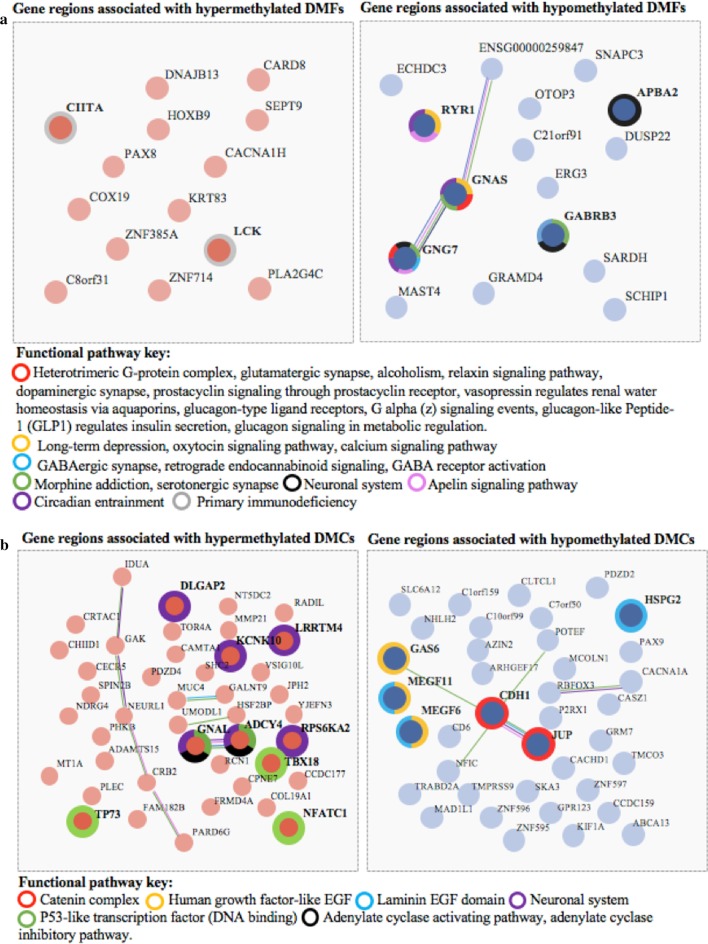
Fig. 6.
STRING diagrams showing functional relationships between hyper- and hypo-methylated DMFs within gene regions (a) and functional relationships between hyper- and hypo-methylated DMCs within gene regions (b). Colours highlighting specific genes indicate their presence within an overrepresented functional pathway determined through a STRING analysis. Functional pathways all have a FDR-corrected P value < 0.05. A full list of the functional pathways with associated P values and gene numbers in sets is included in Additional file 1: Excel file ‘DMAP_Pathways and ‘MethylKit_Pathways’

