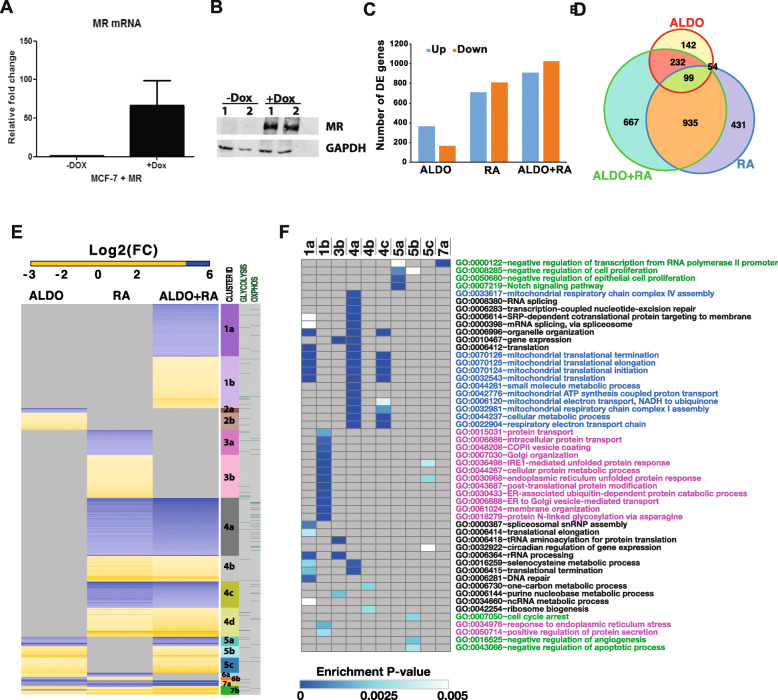
Fig. 3.
Differentially expressed genes in ALDO-, RA- and ALDO+RA-treated MCF-7 cells. Gene expression profiling of MR-inducible MCF-7 breast cancer cells treated for 6 h with aldosterone (10 nM), all-trans retinoic acid (1 μM) and 17ß-estradiol (10 nM) or their combination and profiled on Illumina’s HT-12 gene expression bead arrays. a MR mRNA expression, measured by RT-qPCR, uninduced and induced with doxycycline. b MR protein expression uninduced and induced with doxycycline. c Numbers of genes up- or downregulated in each treatment condition. d Venn diagram of the gene overlaps between treatment conditions. e Heatmap of the log2 fold change of genes differentially expressed in each treatment condition. Genes are grouped into different gene clusters and annotated with whether the genes are annotated to be involved in the glycolysis or oxidative phosphorylation hallmarks according to MSigDB. f Heatmap presentation of Biological Processes GO terms significantly enriched (enrichment P value ≤ 0.005 and FDR < 10%) in gene clusters annotated in e, only gene clusters with significantly overrepresented GO terms are included in this heatmap. Cell colours represent the enrichment P values. Grey indicates no significant GO term was identified

