Fig. 6.
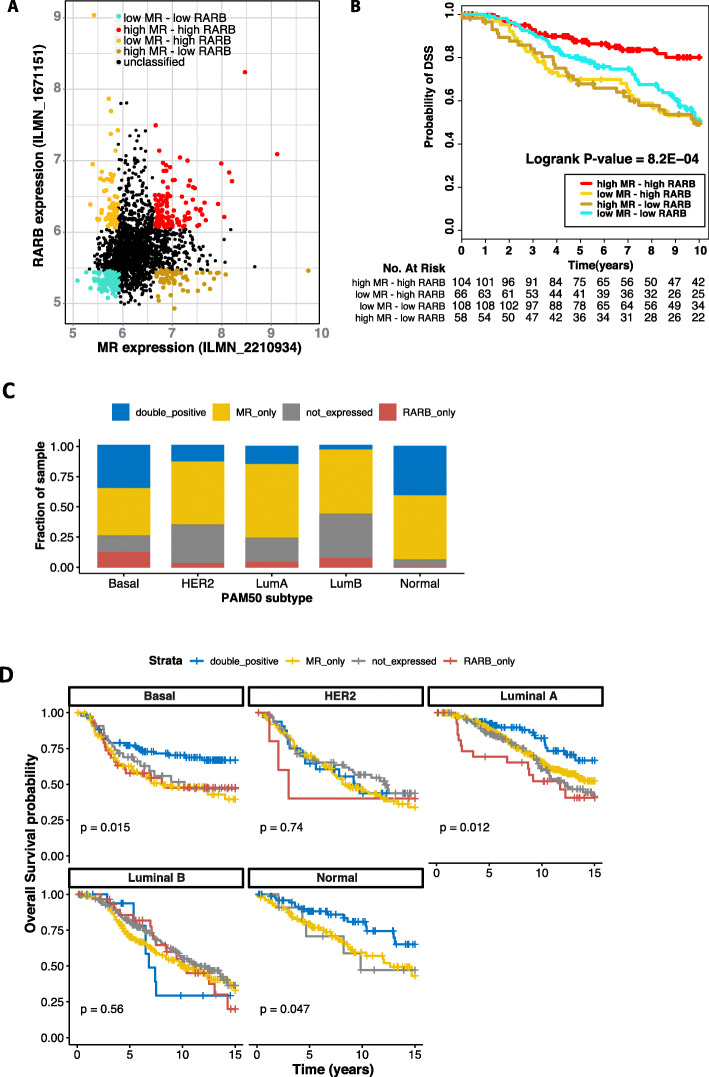
Survival analysis of breast cancer tissues expressing high MR and RARB. a Scatter plot of expression of MR against RARB in breast cancer samples from the METABRIC dataset. A receptor is classified as highly or poorly expressed in a sample if its expression in that sample is in the top or bottom 20% of its expression range respectively. b Kaplan-Meier analysis showing samples expressing a high level of both MR and RARB have better survival outcome. c All breast cancer samples from the METABRIC breast cancer microarray dataset were classified into four categories: double-positive cases express both MR and RARB based on probe expression cut-off defined in Fig. S3 (blue bars); MR_only cases express MR but not RARB (yellow bars); RARB_only cases express RARB but not MR (red bars); and not_expressed cases do not express MR or RARB (grey bars). The stacked column plot shows the percentage of each of the four categories within each PAM50 subtype from the METABRIC dataset. Here the classification of each breast cancer sample into PAM50 subtype is as defined by the METABRIC publication. d Kaplan-Meier plot for each of the four categories of MR and RARB expression, for all breast cancer samples with survival data in the METABRIC dataset, sub-divided by PAM50 subtype. Due to having only one sample categorized as expressing only RARB, there is no survival curve for this category in the normal-like subtype

