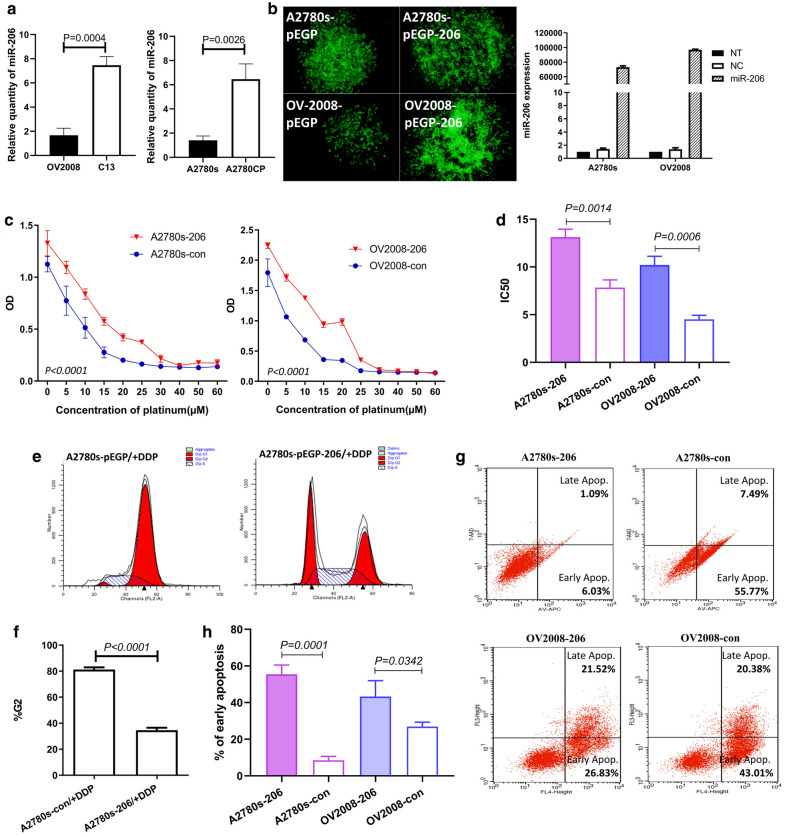
Fig. 3.
Overexpression of miR-206 increased the resistance of EOC to cisplatin. A2780s and OV2008 cells were stably transfected with pre-miR-206 or vector control and then subjected to different assays. a qRT-PCR showed miR-206 expression in parental cisplatin-sensitive EOC cell lines A2780s and OV2008 and their cisplatin-resistant variants A2780CP and C13. b qRT-PCR showed miR-206 expression in various EOC cell lines. c The MTS results show the dose–response curve of cisplatin. d The IC50 values are shown. e Flow cytometry results showed the comparison of the cell populations in the G0/G1, S and G2/M phases between the A2780s and A2780s-206 groups. f Bar graphs showing the percentage of cells in the G2 phase detected by flow cytometry. g Annexin V flow cytometry assessment of the apoptotic cell population after 24 h of cisplatin treatment. h The percentage of cells in early apoptosis

