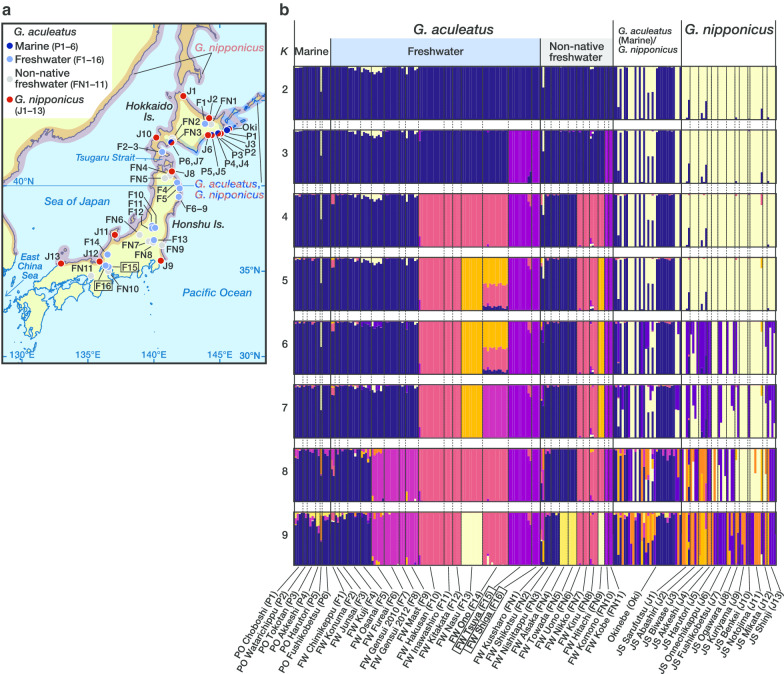
Fig. 1.
a Sampling sites in the Japanese Archipelago and distribution ranges of marine Gasterosteus aculeatus and G. nipponicus. See b for population codes. Distribution range of G. nipponicus is shaded in red. The distribution range of marine G. aculeatus, which overlaps with that of G. nipponicus in the Japanese Archipelago, is hatched in dark blue. Population codes enclosed in a box (F15 and F16) indicate the native habitats of the hariyo sticklebacks. The distribution ranges followed those of Higuchi [100], Higuchi et al. [33], Kitano and Mori [28] and Yoshigou [101]. The map was created with rnaturalearth ver. 0.1.0 (https://github.com/ropensci/rnaturalearth) and sf ver. 0.9-0 (https://r-spatial.github.io/sf/). b Bar plots showing the results of the population structure analyses of Japanese samples based on 2735 SNPs with ADMIXTURE (K = 2–9). Individuals are represented as vertical bars proportional to the genotypes belonging to each of the genetic clusters. Population codes in brackets follow population names. Population names enclosed in a box (FW Tsuya [F15] and FW Shiga [F16]) indicate the hariyo sticklebacks

