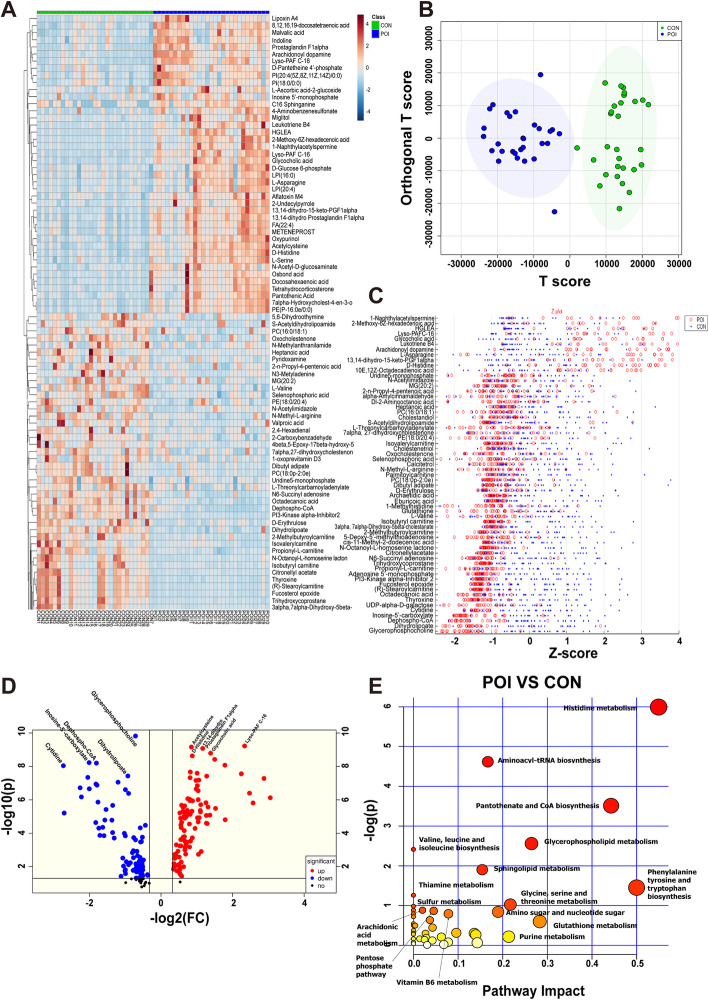
Fig. 2.
Metabolomics analysis of ovarian tissues from the control and POI groups. a Heat map analysis of differential metabolites changes induced by chemotherapy in ovarian samples (control and POI groups). b OPLS-DA score plot of ovarian samples from both the control and POI groups. c Z-score plot of the screened metabolites in the ovarian samples of the control group and POI group. Each spot represents a metabolite. The control group is shown in blue, and the POI group is shown in red. Z-scores are sorted in descending order, in which the magnitude of the change indicates the fold by which the mean of the control group is higher or lower than its standard deviation. d Volcano plot of screened differential metabolites for both groups. Each spot represents a metabolite, and the scattered spots represent the final screening results. Significantly upregulated metabolites are shown in red, significantly downregulated metabolites are shown in blue, and nonsignificantly different metabolites are shown in black. e KEGG was used to analyze the metabolic pathways in ovarian tissues, and metabolic pathways with P < 0.05 are shown

