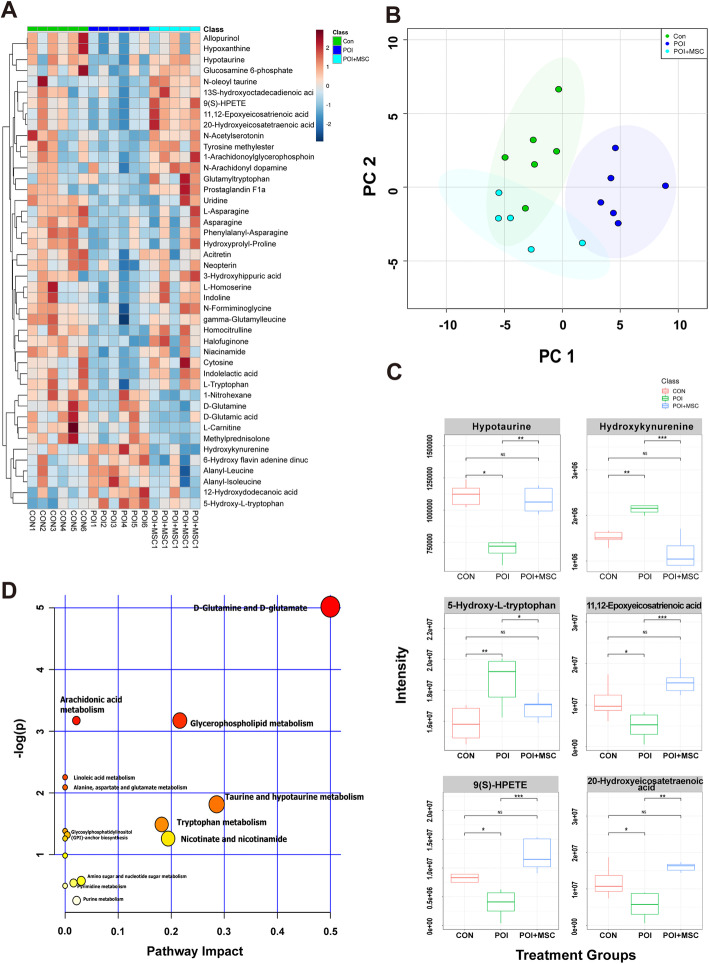
Fig. 6.
Pseudotargeted metabolomics of nonlipids from ovarian samples. a Heat map of all three groups shows the trends of differential metabolite expression pattern before and after the hUCMSC treatment. b PCA score plot reveals differences in the expression levels of targeted metabolites after hUCMSC transplantation. c The box chart shows that pseudotargeted metabolomics is designed for the differential metabolites screened after POI modeling. The results show that the expression of some metabolites returns to the level of the control group after treatment. d KEGG was used to analyze the metabolic pathways of different metabolites that changed significantly after hUCMSC transplantation

