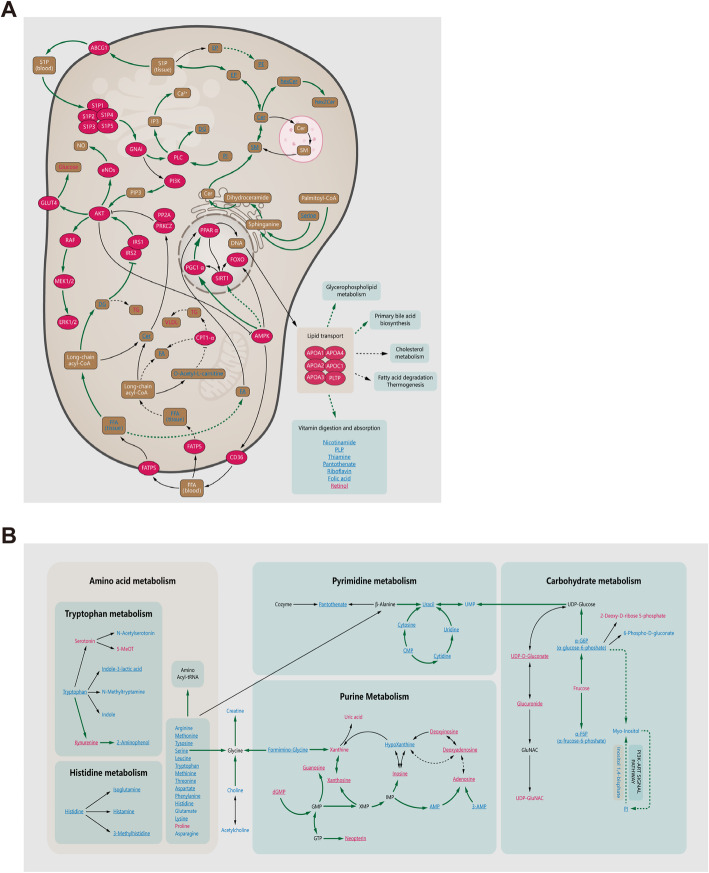
Fig. 7.
Metabolomics analysis of the mechanisms of hUCMSC treatment for POI. The pathway map shows the changes in metabolites and metabolic pathways in the ovaries of the hUCMSC-treated group compared to those of the POI group. a Map of regulation pathways involved in total metabolite. b Map of regulatory pathways between amino acids, purines, pyrimidines, and carbohydrate metabolism. Significantly upregulated metabolites are shown in red, significantly downregulated metabolites are shown in blue, and nonsignificant different metabolites are shown in black. The names in bold are the relevant metabolites detected in the nontarget/target metabolomics analysis. The substance in the red ellipse represents the enzyme or its corresponding protein. The solid arrow indicates that metabolites (enzymes/proteins and metabolites) have a direct relationship with each other, while the dotted arrow indicates a distant relationship. Tissues or parts of metabolic processes (such as lysosomes) are represented by solid frames, and related pathways (such as glycerolipid pathways) are represented by dotted frames. The underlined metabolites represent the metabolites that recovered after hUCMSC transplantation compared to the changes after POI induction. The green arrows represent the paths recovered. Abbreviations: Cer, N-acylsphingosine; DG, diacylglycerol; FA, fatty acid; FFA, free fatty acid; hexCer, glucosylceramide; hex2Cer, lactosylceramide; PE, phosphatidylethanolamine; PI, phosphatidyl-myo-Insitol; SM, sphingomyelin; phSM, sphingomyelin-1-phosphate; TG, triacylglycerol; α-G6P, α-glucose-6-phoshate; α-F6P, α-frucose-6-phoshate

