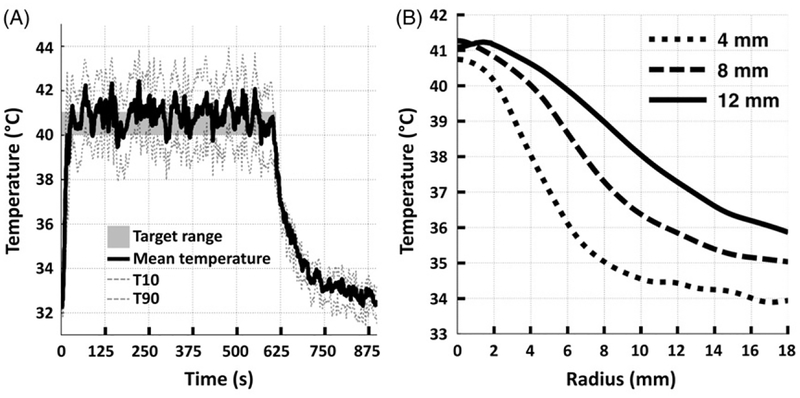
Figure 6.
(A) Representative examples of mean (solid), T10, and T90 (dashed) temperatures within an 8mm treatment cell over a 10 min sonication in vivo. Target temperature range is indicated as a grey box. (B) Representative examples of time-averaged mean temperature radial line profiles centred on the treatment cell for 4 mm, 8mm, and 12 mm treatment cells.

