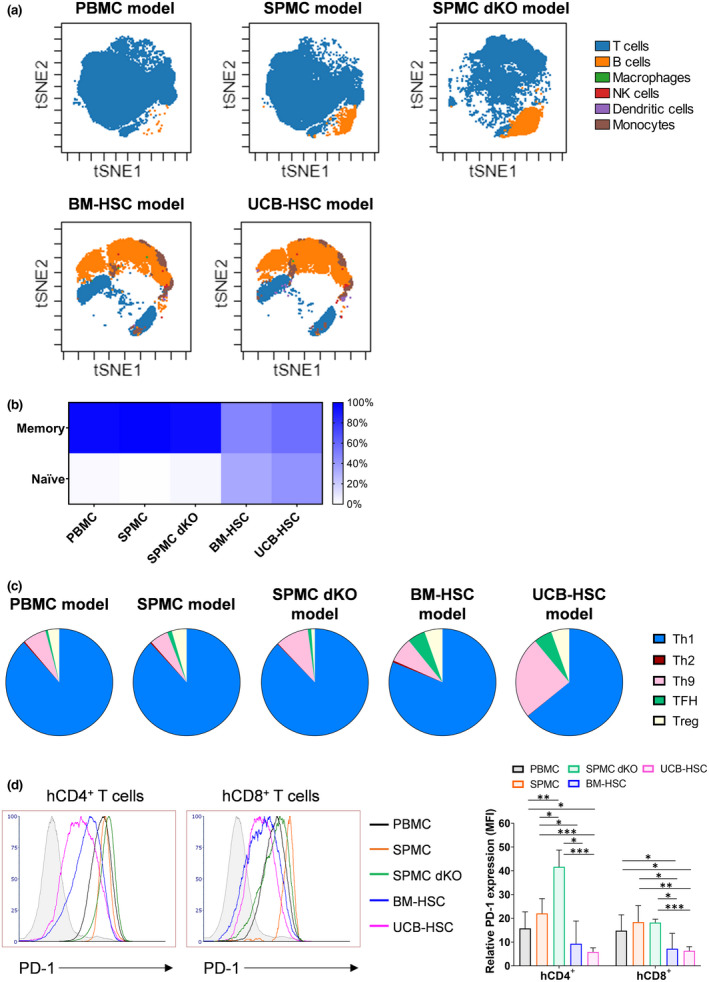
Figure 3.

Immunophenotyping of hCD45+ cells infiltrating the spleen of the different humanised mouse models. (a) Visualisation using t‐SNE (t‐stochastic neighbour embedding) of immune subpopulations within hCD45+ cells infiltrating the spleen of one representative mouse in each model (Donors 3 and 4) at sacrifice analysed by flow cytometry. (b) Percentage of memory phenotype on hCD3+ T cells infiltrating the spleen of mice. (c) Representative data of hCD4+ T helper cell subtypes and their proportions of the whole hCD4+ population. Mean of all donors combined is shown in b and c. (d) Expression of PD‐1 on hCD4+ and hCD8+ T cells. Histograms are representative of one mouse in each model (Donors 3 and 4). Relative PD‐1 expression on hCD4+ and hCD8+ T cells in the spleen of mice. The MFI is plotted as a relative fold difference as compared to the FMO controls. Mean ± SD are shown. Mice and donor numbers are the same as in Figure 1. A two‐way ANOVA was used to determine significant differences between models; *P < 0.05, **P < 0.01, ***P < 0.001. BM‐HSC, bone marrow haematopoietic stem cells; FMO, fluorescence minus one; MFI, mean fluorescence intensity; NK, natural killer; PBMC, peripheral blood mononuclear cells; SPMC dKO, SPMC model in NSG double knockout mice; SPMC, spleen mononuclear cells; TFH, T follicular helper; UCB‐HSC, umbilical cord blood haematopoietic stem cells.
