
Figure 5.
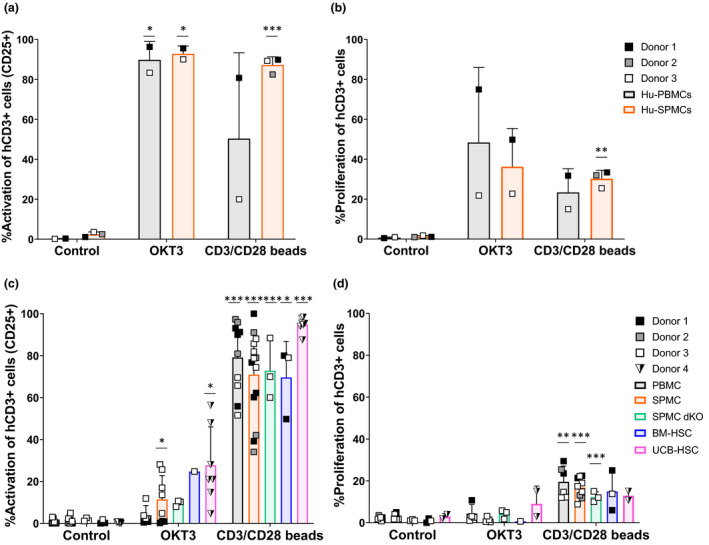
Activation and proliferation of human T cells pre‐ and post‐engraftment in mice. (a) Percentage of activated hCD3+ T cells (CD25+) and (b) proliferating hCD3+ T cells (CFSELow) in Hu‐PBMCs and Hu‐SPMCs samples before engraftment into mice, after 72 h of in vitro culture. Data of three independent experiments with Donors 1–3 are shown. (c) Percentage of activated hCD3+ T cells (CD25+) and (d) proliferating hCD3+ T cells (CFSELow) isolated from the spleen of humanised mice at the experiment endpoint, after 72 h of in vitro culture. Mice and donor numbers are the same as in Figure 4b. Individual data and mean ± SD of all donors combined are shown. The non‐paired t‐test and two‐way ANOVA were used to determine significant differences between control and treated groups in each model; *P < 0.05, **P < 0.01, ***P < 0.001. BM‐HSC, bone marrow haematopoietic stem cells; Hu‐PBMCs, human PBMCs inoculum; Hu‐SPMCs, human SPMCs inoculum; PBMC, peripheral blood mononuclear cells; SPMC dKO, SPMC model in NSG double knockout mice; SPMC, spleen mononuclear cells; UCB‐HSC, umbilical cord blood haematopoietic stem cells.