
Figure 6.
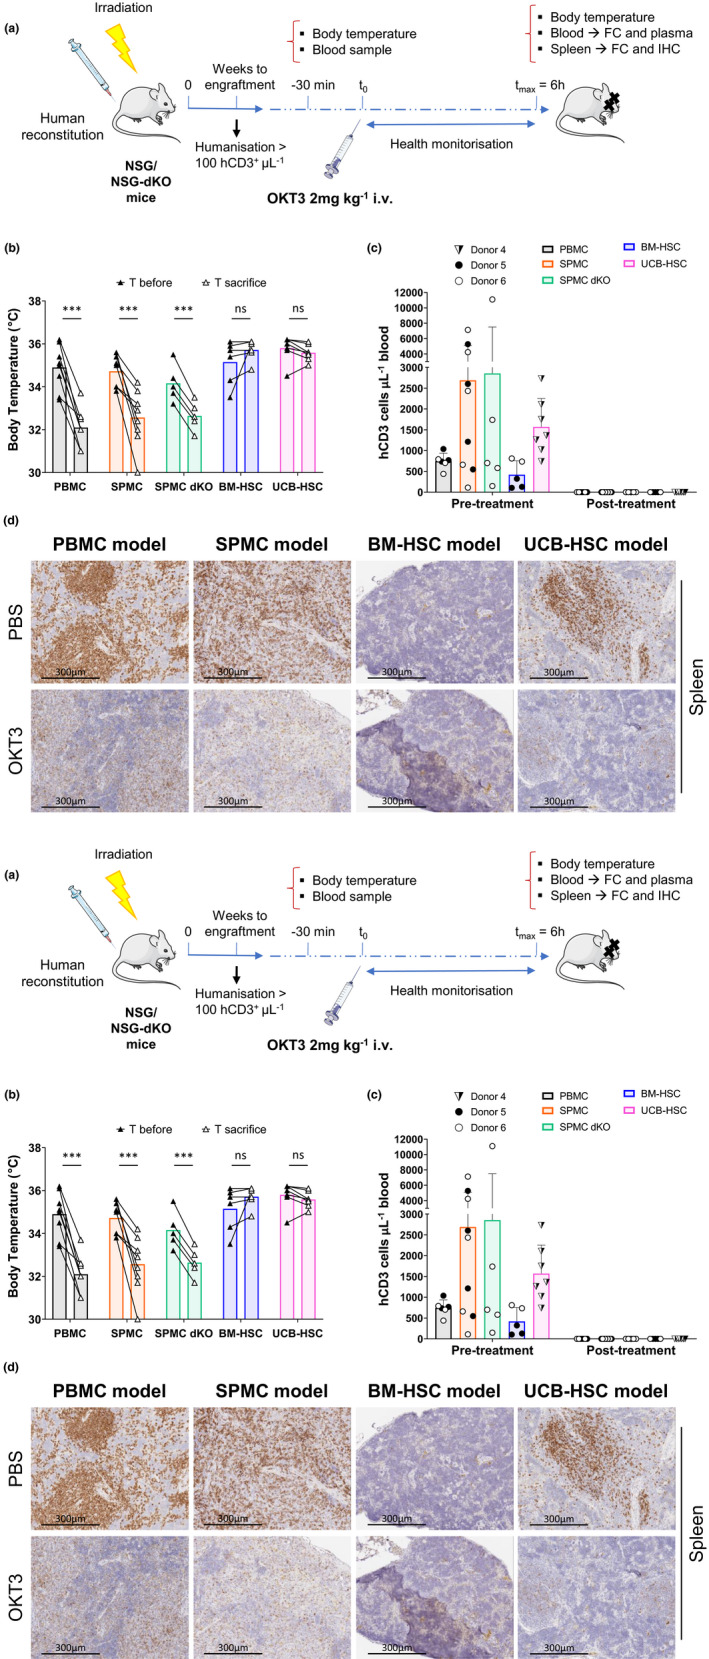
Response to OKT3 treatment in different humanised mouse models. (a) Experimental design to evaluate induction of cytokine release syndrome in humanised mice. (b) Body temperature (°C) of OKT3‐treated mice before and 6 h after treatment. The paired t‐test was used to determine significant differences before‐after OKT3 treatment. (c) Number of hCD3+ T cells per μL of mouse blood assessed before and 6 h after OKT3 treatment. (d) Representative images of the hCD3+ T‐cell staining of the spleen of one PBS and one OKT3‐treated mouse in each model, corresponding to mice reconstituted with Donors 4 (UCB‐HSC model) and 5 (PBMC, SPMC and BM‐HSC models), magnification ×200. (e) Human cytokines secreted into mouse plasma evaluated in PBS and OKT3 treated mice at sacrifice. For the PBMC (n = 6 or 7), SPMC (n = 8 or 9) and the BM‐HSC (n = 5 or 6) models, data from two independent experiments with Donors 5 and 6 in each model are shown. Data in the NSG‐dKO mice (n = 3–5) correspond to one experiment reconstituting with SPMCs cells from Donor 6. In the UCB‐HSC model (n = 6 or 7) data are representative of two independent experiments with Donor 4. Individual mouse data and mean ± SD of all donors combined are shown. The non‐paired t‐test was used to determine significant differences between PBS and OKT3 treated mice in each model; *P < 0.05, **P < 0.01, ***P < 0.001. BM‐HSC, bone marrow haematopoietic stem cells; FC, flow cytometry; IHC, immunohistochemistry; NSG‐dKO, NOD scid gamma double knock out; PBMC, peripheral blood mononuclear cells; SPMC dKO, SPMC model in NSG double knockout mice; SPMC, spleen mononuclear cells; T, temperature; UCB‐HSC, umbilical cord blood haematopoietic stem cells.