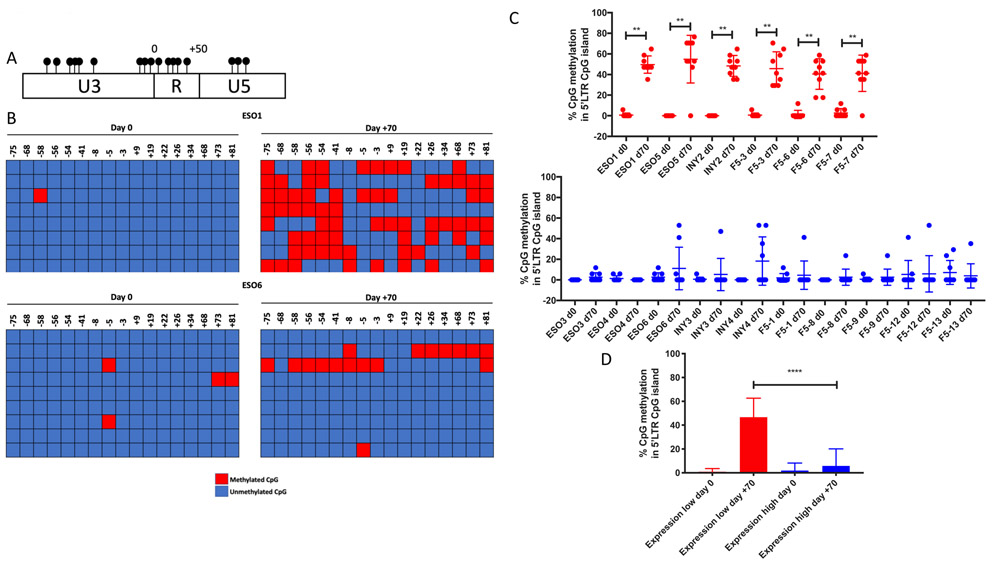
Figure 2. Increased MSCV 5’LTR methylation is associated with decreased expression of the transgenic RNA and protein, despite persistence of the transgenic DNA.
A) CpG island within the MSCV 5’ LTR, where each CpG loci is represented by a filled circle. Numbering is relative to the transcription start site. B) Bisulfite conversion was performed on genomic DNA from patient PBMCs at day 0 (infusion) and day +70, and the CpG island within the MSCV 5’LTR promoter region was PCR amplified and purified; two representative patients are shown. Each row represents sequencing of an individual experiment, with methylated cytosine loci indicated by red boxes and unmethylated loci by blue boxes. CpG loci positions are listed at the top of the graph relative to the TSS for the transgenic TCR. C) Percentage of CpG methylation within 5’LTR at day 0 and day +70 in individual expression-low (red) and expression-high (blue) patients (** p<0.01, Wilcoxon matched-pairs signed rank test); comparison between aggregate percent CpG methylation within the 5’LTR between all expression-high and expression-low patients at day 0 and day +70 is shown in D (**** p<0.0001, Mann-Whitney U test).

