Fig. 1.
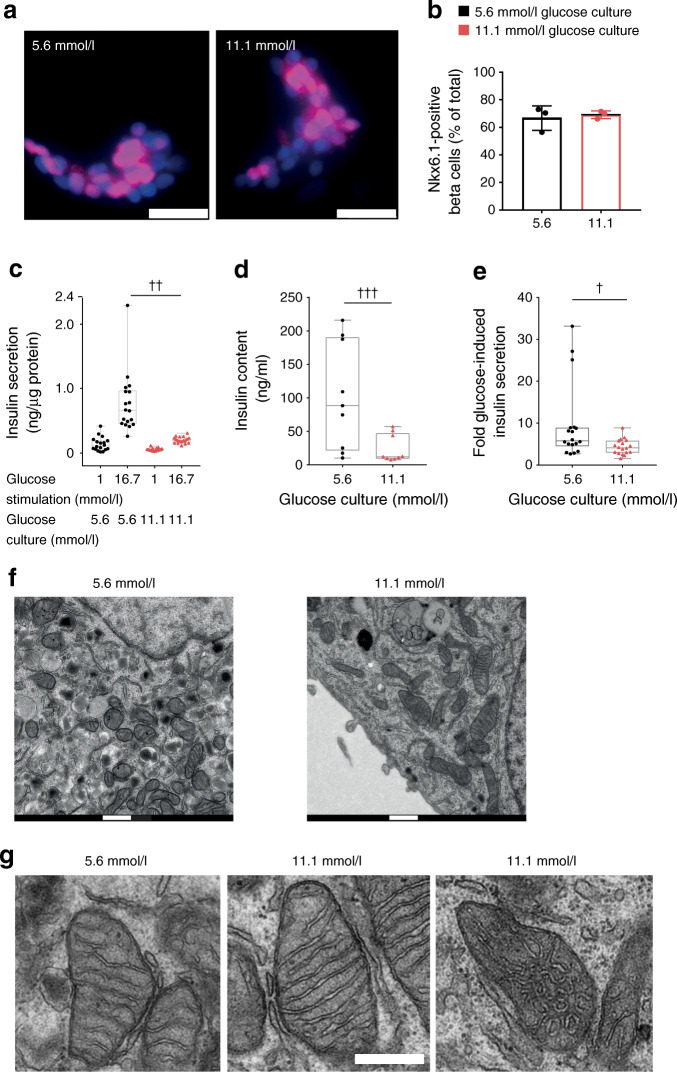
Modest beta cell dysfunction in response to glucose stress. (a) Nkx6.1 immunofluorescence labelling (pink) in human islet clusters grown for 4 days in culture medium supplemented with either 5.6 mmol/l or 11.1 mmol/l glucose. Nuclei were stained with DAPI (blue). Scale bar, 25 μm. (b) The percentage of Nkx6.1-positive cells was determined after 4 day culture in 5.6 mmol/l glucose (black bar) or 11.1 mmol/l glucose (red bar). The mean from three donors ± SD is shown; >25 images per donor and condition were quantified. Statistical significance was calculated using a t test (not significant). (c) Acute glucose-induced insulin secretion was measured from human islet clusters following 4 days of culture in islet medium containing either 5.6 mmol/l (black circles) or 11.1 mmol/l glucose (red triangles). Basal conditions were established in KRBH containing 1 mmol/l glucose. Insulin secretion was measured after 30 min in 1 mmol/l glucose followed by 30 min stimulation with 16.7 mmol/l glucose, as indicated. Results are from three donors (n = 18). LMM, ††p < 0.01. (d) Insulin content in human islet clusters was measured in separate samples from the same three donors as shown in (c) in KRBH containing 1 mmol/l glucose (n = 9). LMM, †††p = 2.24 × 10⁻⁸. (e) Insulin secretion was expressed as fold change of glucose-induced (16.7 mmol/l) insulin secretion divided by basal (1 mmol/l glucose) secretion. Results are from three donors (n = 18). LMM, †p = 0.02. (f) Electron micrograph of a beta cell in an islet cluster grown for 4 days in 5.6 mmol/l or 11.1 mmol/l glucose. (g) Cristae morphology of mitochondria in beta cells grown in 5.6 mmol/l glucose or 11.1 mmol/l glucose. Also shown is a representative image of a small subset of mitochondria from cells grown at 11.1 mmol/l glucose displaying perturbed cristae morphology. Scale bars, 500 nm

